We are often asked: ‘why not look at total return yields to shareholders (dividends and share buybacks) rather than simply dividends?’ In countries such as the USA, share buybacks are favoured over dividends by companies, and it would appear by investors too. European companies may also be increasingly favouring this method of “return to shareholders”.
The reason why as a team we dismiss buybacks is that for much of the time they are the complete opposite of a “return to shareholders”. Invariably they usually penalise existing shareholders in complete contradiction of how they are perceived.
In their text-book form, buybacks are attractive when conducted at the right time. They are, in essence, a transfer of value. When the company buys its own shares at a valuation below its intrinsic value and cancels them, it is transferring value from the sellers to the remaining holders. History demonstrates that, when conducted in a large size in one go, the benefit to remaining shareholders is at its greatest.[1] Unfortunately, as is so often the case, perfection in textbooks rarely manifests in the real world.
Logically, given the above, if buybacks are conducted above the company’s intrinsic value, the transfer of value flows the opposite way – to the sellers. So, the first thing to look at is when do the majority of buybacks happen?
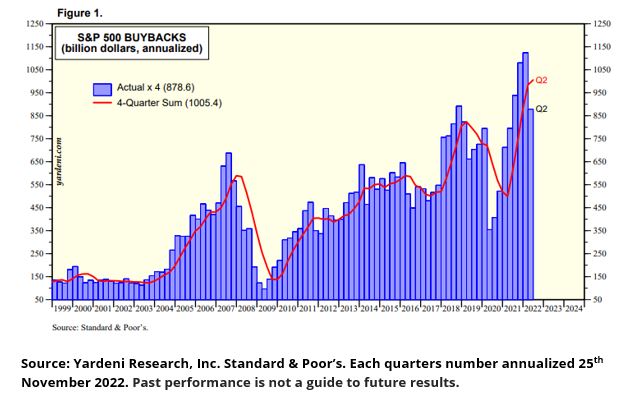
The graph below from Ed Yardeni shows that the majority of buybacks occur at the top of markets and to compound the error, disappear at the lows. The complete opposite of the textbook. Therefore, those who benefit are the sellers not the investors. Further indignity is piled on, because not only do buybacks disappear at the bottom they are also replaced with share issuance, further diluting existing holders.

Many claim however that the favourable tax system makes it far more sensible to return value to investors via buybacks – as they represent capital gain – than dividends that represent income. In the US, the tax advantage is real. Whether the gap between taxes is enough to offset the transfer of value away from investors depends on how far above intrinsic value the shares are purchased. And of course, we are still assuming that the repurchased shares are cancelled.
However, a more disturbing conclusion is reached when again the data is studied. Many buybacks are simply used to offset the dilution of share-based compensation. Because of the tax advantage of being paid in capital gain rather than income, share schemes are sometimes the preferred method of paying senior management.
Let’s look at an example of Microsoft, a stock we do not currently own in the Redwheel Global Equity Income strategy. Over the three years to June 2022, they used 42% of the cumulative free cash flow (cash from operations minus capex) to repurchase shares. This amounted to 322m shares costing c.$71bn. However, the share count of Microsoft over that period only fell by 136m shares.[2] In other words, 58% of the buyback was not cancelled but instead offset other share issuance – mainly share-based awards. In the June 2021 published accounts there remained a further 100m non-vested stock awards. The free cashflow of the company simply transferred to the senior management and this looks set to continue into the future.
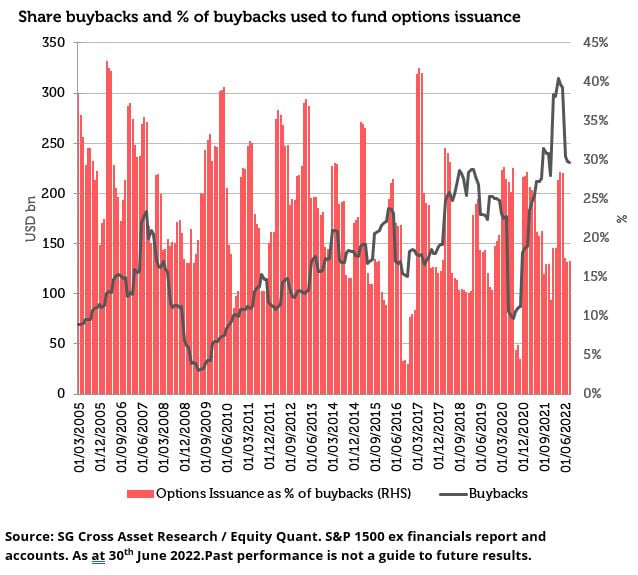
This applies to many companies conducting buybacks. The chart below is from data supplied by Andrew Lapthorne, Head of SG Equity Quant research. When we look only at companies doing buybacks in the S&P 1500 ex-financials, we can see that, consistently, a meaningful percent of buybacks is used to fund the issue of options schemes. The maximum is 43% of the buybacks used for options and the average since March 2005 is 22%.

The narrative that it aligns management and investors to share price appreciation is arguably nonsense when many options are issued far below the prevailing price together with the tendency of equities to rise over time. This, coupled with the magnitude of so many schemes being wholly unrelated to the success, or otherwise, of the company means such alignment can be seen to be tenuous at best.
The distribution of the buyback is wholly unequal too. Many long-term investors do not want to sell their holdings. In the textbook, they should remain holders to receive the value transferred back to them! The distribution of the benefit is skewed heavily to the few, those with the geared option schemes linked to the shares. The effect of the buyback is truly different across those with an interest in the ownership of the company.
So now, you have a situation where the majority of buybacks are conducted above intrinsic value to simply fund the exercise of share option schemes. In essence, existing holders are transferring value from themselves directly to the senior management team, in a “tax efficient” manner for the recipients.
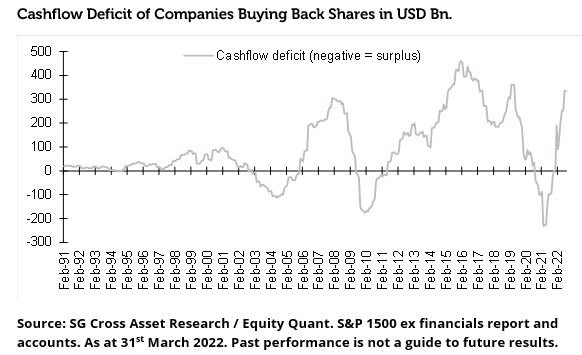
If only that was the end of the story. To land the final blow, data shows that a large proportion of buybacks are either funded from a hugely significant percentage of the cash flow of the company (leaving little for investment) or, worst of all, are debt funded. The trend to borrow debt to fund buybacks is driven by debt being so cheap to fund. This means that many companies have now simply added more debt to their balance sheets, simply to pay the monies borrowed directly to the senior management team via buybacks funding share option schemes maturing. The below chart, again from Andrew Lapthorne, shows how borrowing to fund buybacks has increased since 2006 onwards.

So now, not only have existing shareholders transferred value to management, they also now own a company with increased debt levels. This is not taking advantage of cheap debt to invest in projects that could generate returns greater than the cost of the debt and thus increase future cash flow. No, simply borrowing monies to give to individuals.
It is rare to find a company that actions buybacks in a text-book fashion. And given that investing is a continuous endeavour, statistically fishing for such rare beasts is stacking the odds against you. This is why we focus solely upon dividends.
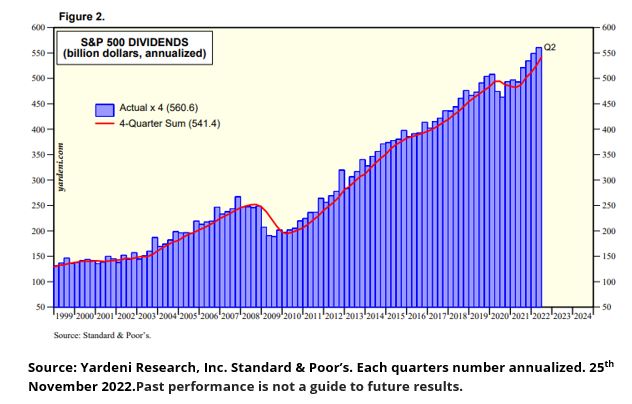
Again, many companies do not, or are not able to, follow the text-book approach to dividends, that is making them durable and grow over time. But enough of them do, as shown in the chart below from Ed Yardeni, where dividends are far more stable. An active approach means one can invest in companies who will pay dividends in good and bad times, who grow them in a real sense over time, and thus can be relied upon to be able to compound over time to become the main driver of one’s total return. Dividends represent an equal distribution to all investors, be they longer-term investors or employees or pension funds. Everyone receives the same per share distribution. Dividends as a means of returning value to shareholders is statistically advantageous for investors, truly aligned to their long-term objectives in a manner of equality.

Sources:
[1] The Outsiders by William Thorndike
[2] Microsoft Report and Accounts 2021 and Highlights of 2022
Key Information
No investment strategy or risk management technique can guarantee returns or eliminate risks in any market environment. Past performance is not a guide to future results. The prices of investments and income from them may fall as well as rise and an investor’s investment is subject to potential loss, in whole or in part. Forecasts and estimates are based upon subjective assumptions about circumstances and events that may not yet have taken place and may never do so. The statements and opinions expressed in this article are those of the author as of the date of publication, and do not necessarily represent the view of Redwheel. This article does not constitute investment advice and the information shown is for illustrative purposes only.


