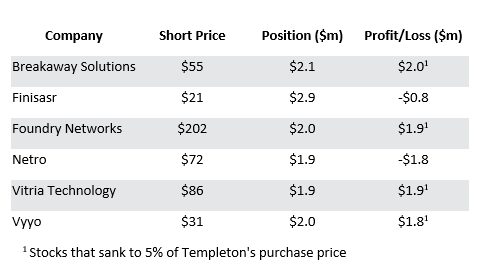
Anyone who was investing in 2000 when the TMT bubble began to pop will remember that it was the smaller, more speculative end of the market that rolled over first before being followed by the large cap end of technology, media and telecommunications stocks. In her book, ‘Investing the Templeton Way’ Lauren Templeton recounts how her Great Uncle, Sir John Templeton, successfully exploited this by shorting 88 NASDAQ stocks. His approach was to focus on stocks which had trebled from their IPO price which typically involved the smaller and more speculative names and then he would place short bets on them eleven days before the lock up period expired in the anticipation that insiders would start selling. Having placed a short position of $2.2million on each of these stocks ($185million in total), he subsequently closed them out for a profit of over $90m. The stocks in the table below were those that lost 95% from Templeton’s short price.

Past performance is not a guide to the future. The price of investments and the income from them may fall as well as rise and investors may not get back the full amount invested.
The information shown above is for illustrative purposes only and is not intended to be, and should not be interpreted as, recommendations or advice.
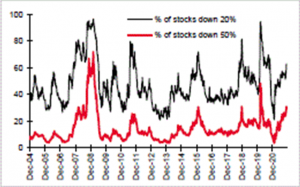
I was reminded of this when I saw a chart from Andrew Lapthorne at Societe Generale showing that almost one-third of stocks in the Nasdaq Composite have lost over 50% from their 200-day peak.
Percentage of Stocks in the Nasdaq Composite Down 50% and 20% From Their 200-Day High

Past performance is not a guide to the future. The price of investments and the income from them may fall as well as rise and investors may not get back the full amount invested.
The information shown above is for illustrative purposes only and is not intended to be, and should not be interpreted as, recommendations or advice.
Given this, one might wonder how the NASDAQ Composite Index can be up 21% year to date and the S&P500 Index +25% (Source: Bloomberg 8th December 2021). The answer lies in the fact that the mega cap technology stocks have generated most of the returns; according to data from Bloomberg, over the last 6 months, 4 stocks (Microsoft, Apple, Nvidia and Google) have generated almost 70% of the S&P 500’s return. Those who only look at the headline index will therefore have missed out on what has been happening beneath the surface which has been quite eye opening.
- The Goldman Sachs Index of technology companies that have yet to make a profit has declined by 25% in a month.

Within this there have been some remarkable declines. Uber, the global taxi firm, has plunged 48% since April, which reduced its market capitalization to $70 billion. The firm that we all came to know during lockdown, Zoom Video [ZM] has plunged 67% from the peak of $568 on October 19, 2020 to $183.
- The ARK Innovation ETF that invests in companies from online shopping to crypto exchanges, has plunged 41% since the peak in February.

Past performance is not a guide to the future. The price of investments and the income from them may fall as well as rise and investors may not get back the full amount invested.
The information shown above is for illustrative purposes only and is not intended to be, and should not be interpreted as, recommendations or advice.
- The Invesco Golden Dragon ETF, which tracks Chinese ADRs listed in the US – its largest five holdings are Baidu, Nio, JD.com, Alibaba, and Pinduoduo – has collapsed by nearly 60% since the peak in February 2021.

Past performance is not a guide to the future. The price of investments and the income from them may fall as well as rise and investors may not get back the full amount invested.
The information shown above is for illustrative purposes only and is not intended to be, and should not be interpreted as, recommendations or advice.
- Here in the UK, some of the so-called technology stocks appear to have been over-hyped by the sell-side including The Hut Group, an online retailer of beauty and nutrition products and described as ‘A global brand builder powered by Ingenuity’ by one of the investment banks involved in the IPO. Having seen an initial pop in its share price, it has now declined by nearly 80% since its peak.

Past performance is not a guide to the future. The price of investments and the income from them may fall as well as rise and investors may not get back the full amount invested.
The information shown above is for illustrative purposes only and is not intended to be, and should not be interpreted as, recommendations or advice.
- Another recent IPO that has so far failed to live up to expectations is Darktrace, an autonomous cyber security platform which uses artificial intelligence to detect, investigate and respond to cyber threats in real time. This share price is now 56% below its high a few months ago.

Past performance is not a guide to the future. The price of investments and the income from them may fall as well as rise and investors may not get back the full amount invested.
The information shown above is for illustrative purposes only and is not intended to be, and should not be interpreted as, recommendations or advice.
Of course, it’s entirely possible that this doesn’t herald a rerun of what happened in 2000 but this sort of narrowing of market returns can be a portent of a future decline[1]. It’s worth recalling, however, that whilst March 2000 was the start of a 75% decline in the NASDAQ Index which eventually ended in the third quarter of 2002, it was also the beginning of a bull market in value stocks which saw the US Value Index return 191% up until February 2007 versus 14% for the wider market (Source: Sandford C. Bernstein). Maybe the disappointing returns in the more speculative end of the market will once again be the catalyst for investors to return to buying stocks based on fundamentals and valuation rather than ‘hoped for’ future growth.
No investment strategy or risk management technique can guarantee returns or eliminate risks in any market environment
[1] See, for instance, ‘Motherlode’ by Hussman Advisors, 21 November 2021
Unless otherwise stated, all opinions within this document are those of the RWC UK Value & Income team, as at 10th December 2021.

