(Charts that make you go… hmmm! Revisited)
In February 2021 we looked at ten charts showing just how ebullient many investors had become following years of zero interest rates along with central bank money printing and government bail outs that followed the pandemic. Fast forward just a little over a year and the world looks a very different place. Inflation was not just ‘transitory’, growth is slowing, and fiscal and monetary support is being unwound across the world.
To the moon...
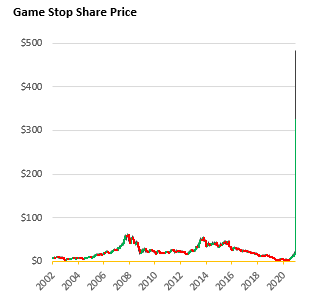
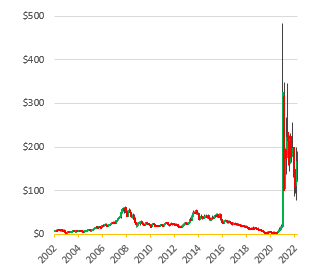
The over 2400% spike in GameStop’s share price was the posterchild for the ‘meme’ trade that emerged during the pandemic. Approximately 140 percent of GameStop’s public float had been sold short and a short squeeze, that was initially triggered by users of an internet forum along with a rush to buy shares to cover those positions as the price rose, caused the share price to rocket.
To put into context just how nuts this move was, GameStop was a loss-making American video game retailer with just $6 billion of sales. At its intraday peak, the company had a market cap of $34 billion and briefly became the largest member of the Russell 2000 Index.
On 28 January 2021, some brokerages halted the buying of GameStop citing their inability to post sufficient collateral at clearing houses to execute their clients‘ orders and the price started to decline. While the price has fallen 70% from its intra-day high, it remains significantly above pre-2021 levels.

Retail speculation
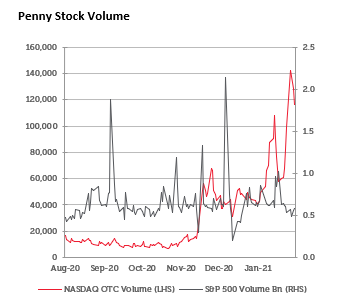
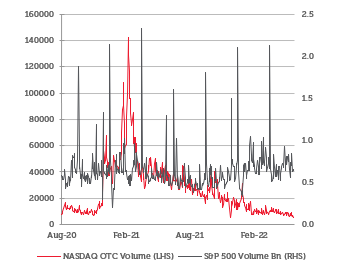
Speculation from retail investors, particularly in penny stocks, saw US equity volumes approach the peak seen during the pandemic crash. While US equity volumes have remained elevated, interest in many penny stocks has tailed off quickly. Volumes in many option markets had also soared, however this is now starting to move lower.

Tesla
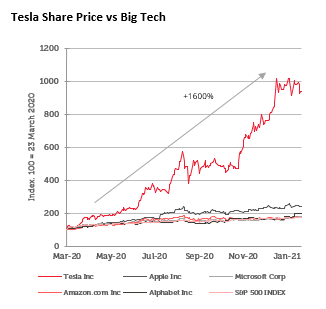
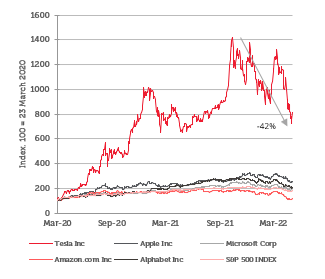
Another company that benefitted from increased retail speculation and helped Elon Musk overtake Jeff Bezos as the world’s richest person was Tesla. The Tesla share price rose 1600% from the March 2020 lows to its peak in November 2021. At its highs, Tesla was worth as much as the next ten largest carmakers, including Volkswagen and Toyota, despite making up less than 1% of global car sales [1] . Since then, the share price has fallen by over 40% amid the wider tech meltdown and news that Elon Musk was buying Twitter.

What Are the Benefits of Making a Profit?
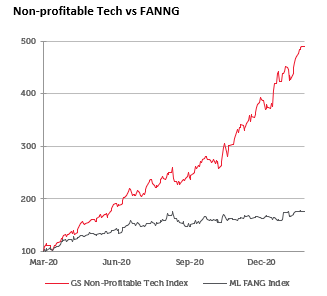
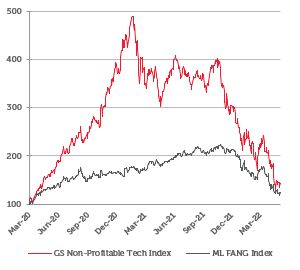
Another set of stocks (GS Non – Profitable Tech Index) that have had to face the reality of the end of low interest rates and easy money. The GS Non-Profitable Tech Index has fallen 70% from its highs.

Bitcoin soars with PayPal and Tesla moves
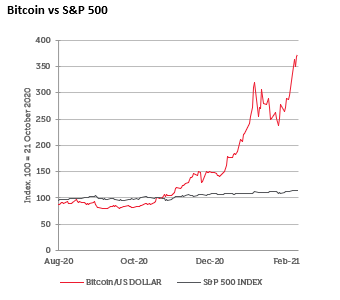
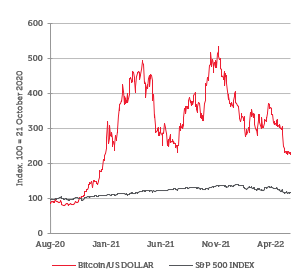
Another favourite of retail investors has been Bitcoin. Back in December 2017 euphoria around the cryptocurrency sent its value vs the US dollar to $15k. However, that quickly fell back to ~$3k and it felt like it was forgotten. That was until in October 2020 when PayPal launched a new service enabling users to buy, hold and sell cryptocurrencies. The price of Bitcoin to USD rose as high as $68k before halving as confidence in the crypto sector waned. More recently the collapse in stablecoin TerraUSD in a pseudo-bank run has also dented the appeal of crypto currencies. Looks like many crypto currencies aren’t a great hedge against inflation, but potentially just another risk on asset.

Pot stocks
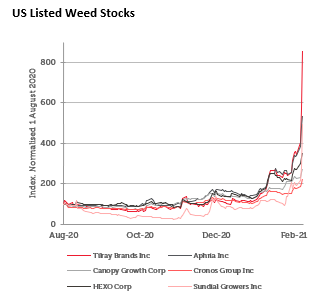
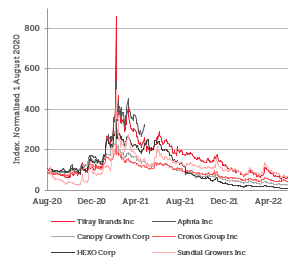
‘Pot stocks’ performed well through 2020 as pot use increased during the pandemic. There was a further boost with Biden winning the 2020 US presidential election as it was expected that federal legalisation would be put in place to spur investment in the US cannabis sector once the Democrats took control of the Senate. However, marijuana legislation failed to gain support in the Senate causing the share price of pot stocks to quickly reverse their gains.

Do fundamentals even matter?
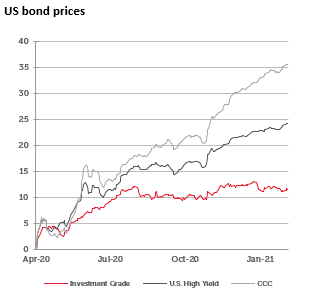
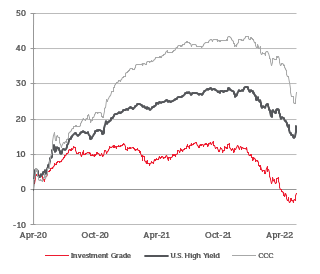
In April 2020, the Fed expanded its efforts to save the world by adding junk bonds to the list of assets it could buy, with CCC-rated bonds leading the rally. In mid-2021, the Fed started to unwind the corporate bond holdings it acquired in 2020 through an emergency lending facility.

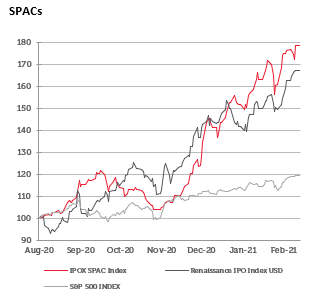
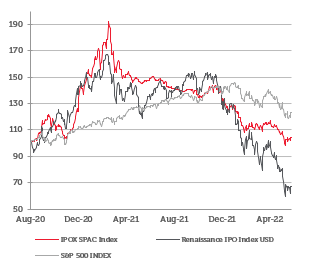
US IPOS, blank-check companies outperforming the broader market
The surge in popularity of Special Purpose Acquisition Companies (SPACs) in 2020 attracted regulatory scrutiny. In 2022, the US SEC proposed reforms to the SPAC market aiming to bring it more in line with traditional initial public offerings. In addition, many of these companies have struggled with rising interest rates and increased recession risk. 25 companies that listed during the SPAC boom of 2020 and 2021 have issued warnings that they could go bust within a year according to Audit Analytics.

Conclusion
It turns out if you print $4 trillion in 18 months along with cutting interest rates at zero, some ‘interesting’ things happen in financial markets. This sort of mania is never sustainable and more usually associated with the final ‘blow-off’ stage of a bubble. It looks like that this is what we have witnessed in the last year. The realisation by central banks that inflation is not transitory means that the monetary policies that created the bubble are now going in to reverse and puncturing the most speculative parts of the market as we have tried to demonstrate. The last few months have also seen the panic for the exit start to do considerable damage to areas that were previously considered a safe place to hide such as the large US technology companies. Our feeling is that this is only the start of the unwind of the excesses highlighted above.
[1] Source: Bloomberg 4th November 2021
Key information:
No investment strategy or risk management technique can guarantee returns or eliminate risks in any market environment. Past performance is not a guide to future results. The prices of investments and income from them may fall as well as rise and an investor’s investment is subject to potential loss, in whole or in part. Forecasts and estimates are based upon subjective assumptions about circumstances and events that may not yet have taken place and may never do so. The statements and opinions expressed in this article are those of the author as of the date of publication, and do not necessarily represent the view of Redwheel. This article does not constitute investment advice and the information shown is for illustrative purposes only.

