At the start of 2022, we wrote a paper entitled ‘How to Survive if the US Equity Bubble Pops: Five Reasons to Buy UK Value’ which proved particularly prescient. By the end of the year, the US equity bubble had indeed popped, and the S&P 500 Index had declined by 18% with the technology heavy NASDAQ index down 33%. The UK market was one of the very few places that produced a positive return, returning 4.6%.[1]
How to survive if the US equity bubble pops: five reasons to buy UK Value
In a longer piece, titled Reversion to long-run mean, we again made the case for a reduced allocation to US equities and an increased allocation to UK equities based once more on the extreme divergence in valuations between the two markets but also noting that in our view many of the factors that had driven US outperformance such as low inflation and declining interest rates were in the process of reversing.
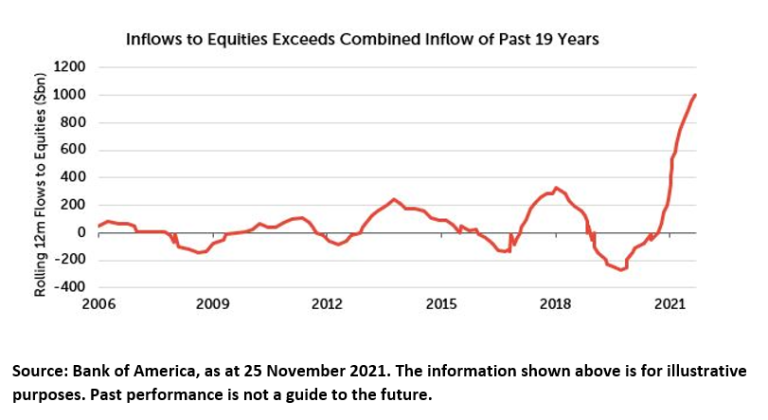
The reason that we made that call is not because we are brilliant macro or market forecasters but because we know we are not and hence we always use base rates and probabilities to guide us. In this instance, GMO’s Jeremy Grantham had identified that there had been 300 bubbles in history (defined as a two sigma move away from long run trend) and all 300 had burst.[2] There had been five super bubbles (defined as a three sigma move) and all five had burst with devastating consequences. The US equity market was the sixth super-bubble. One didn’t need to be Stan Druckenmiller to know that having large amounts of money allocated to US equities at that point in time was probably a bad idea. And yet despite the odds of success being massively stacked against investors, in 2021, more money had gone into US equity funds than in the previous nineteen years added together. If 2021 was the year that the crowd marvelled at the emperor’s new clothes, 2022 was the year when the small boy pointed out that he was naked.
But not only have many investors ignored our advice about the dangers of having a large allocation to US equities, they appear to have completely ignored our advice about the merits of increasing an allocation to UK equities and have done the very opposite of what we were suggesting. The latest data from funds network Calastone[3] shows that investors pulled nearly £870m out of UK focused equity funds in January 2023. That is the 20th consecutive month of outflows and the third worst month on Calastone’s records. Since 2015, investors have sold £7.3billion of UK focused funds and bought £58 billion of funds focusing on anywhere else.
This selling is the continuation of a trend that began about twenty years ago. Back in the mid-nineties when I was a young fund manager at Gartmore looking after the UK part of balanced pension funds (and a young Nick Purves was doing an equivalent job at Schroders), it was standard to have around 55% of the portfolio in UK equities and about another 25% in overseas equities. In addition, because the majority used the CAPS Median as their benchmark, all of the big four pension fund managers (Mercury, Schroders, Gartmore and PDFM) would have a similar weighting across these asset classes which meant that UK pension funds were ridiculously over-exposed to equities in general and UK equities in particular. They subsequently paid for this post-2000 as equities declined and assets within pensions collapsed while falling bond yields meant liabilities increased. This pushed many trustees towards liability matching strategies which usually meant selling equities and buying gilts. These trends can be seen very clearly in the chart below.
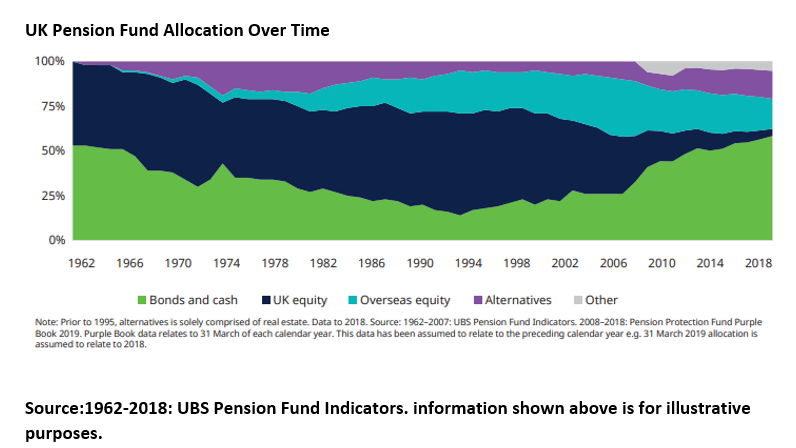
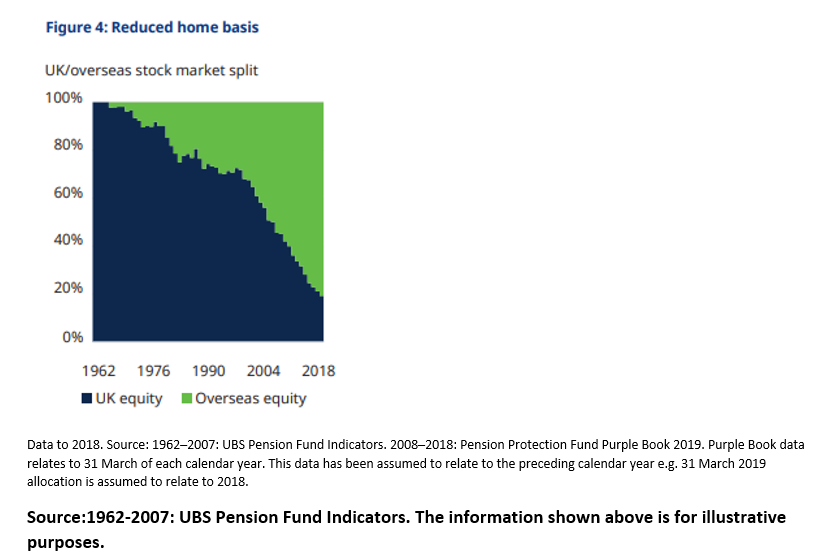
At the same time that the total allocation to equities declined, the balance between UK and overseas also shifted substantially such that the UK approximately represents around 10-15% with overseas making up the balance (see chart below). This reduction of equity exposure combined with a rebalancing from the UK to overseas has created relentless selling pressure on UK equities, which potentially explains why returns have been lacklustre since 2000; even at a new high of 8000, the FTSE 100 Index has only advanced by 15% since its late nineties high whilst the US S&P 500 Index is 183% higher.
At the Redwheel Investment Summit last year, when I had finished presenting the case for UK equities, a delegate came up to me and said, “the UK market has a smaller market cap than Apple, why do I even need to bother with it?” Whilst a little part of my soul died in that moment, the question did highlight the agency problem in a nutshell; we have created an incentive structure that encourages advisors to hug the index which in practical terms means holding high percentages of investors’ money in large markets rather than cheap markets and in large companies rather than cheap companies. No consideration is given to the fact that these markets or companies may have become large by being very expensive nor to the fact that some of the small ones might be cheap.
I think this is crazy. One of the immutable laws of investing is that valuations and subsequent returns are inversely correlated as the chart below demonstrates so clearly. The implication of this chart is that if you consistently buy expensive assets, you will, over time, get lower returns. As an aside, the yellow dot on the bottom right-hand side of the chart signifies the potential twelve year (negative) returns from the S&P500 at the time that this chart was produced which was December 2022. For those with over two thirds of their client’s equity exposure in the US, you are effectively betting that ‘this time will be different’ or you are playing greater fool and hoping that an expensive asset will get more expensive and provide you with the opportunity to get in and get out. Good luck with that.
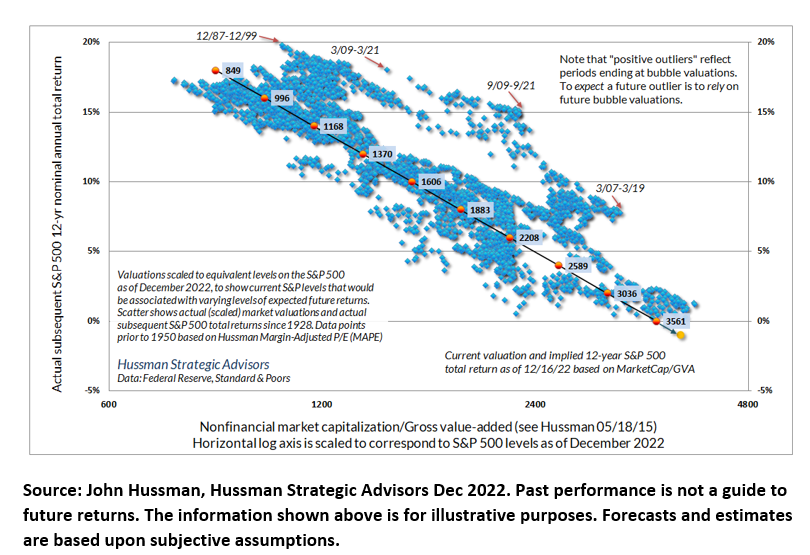
I am constantly surprised how some investment professionals struggle with the concept that starting valuation and subsequent return are inversely correlated. When you buy an equity, you are buying a stream of cash flows and the higher the price you pay for those cash flows, usually the lower your subsequent return. If you pay £32 for £100 a decade from now, your return is 12% (£100/£32)^(1/10)-1=12% whereas if you pay £82 for the same £100 your return is 2% (£100/£82)^(1/10)-1=2%. It really doesn’t matter if you think inflation has peaked and the Fed is going to pivot. When you pay one of the highest valuations that has ever existed for US equities, you are arguably skewing the odds of making a satisfactory return massively against yourself.
So, what explains the extreme levels of negative sentiment towards the UK?
The constant stream of negative headlines probably doesn’t help. Mainstream media feeds us a 24/7 diet of gloom and doom; inflation, rising interest rates, falling real wages, strikes and the looming prospect of higher taxes. ‘Crisis’ has arguably become the most over-used word in the lexicon with the climate crisis, energy crisis and cost of living crisis all competing for air time. I know that it feels like nothing in the country works unless you are fortunate enough to never have to use public transport or the NHS and that barely a day goes by without large swathes of the public sector being on strike. The fact that we have had three Prime Ministers and four Chancellors in eighteen months doesn’t help.
The key point is that none of this matters when it comes to assessing potential long term returns as it is this stream of negative sentiment that has produced the low valuations.
‘It is largely the fluctuations which throw up the bargains and the uncertainty due to the fluctuations which prevents other people from taking advantage of them.’
Also remind yourself that a bearish view on the UK economy has little relevance to the performance of the index where approximately 70% of earnings come from overseas. To give one example, BP has about 2% of its earnings from the UK [5] and hence is not particularly impacted by the performance of the UK economy. Despite this, it attracts a UK discount with the shares trading on 5x earnings versus 10x for Exxon. US investors have woken up to this fact and US buying is cited as one of the reasons that the shares have risen so strongly recently. And let’s remember, those who are selling the UK to go global are selling BP on 5x and then reinvesting the proceeds in Exxon on 10x.[6]
So, if you are someone who cares more about producing good risk adjusted returns for your investors than about benchmark weightings lets re-visit some of the reasons we put forward to own UK equities.
1. The UK is currently one of the cheapest equity markets in the world
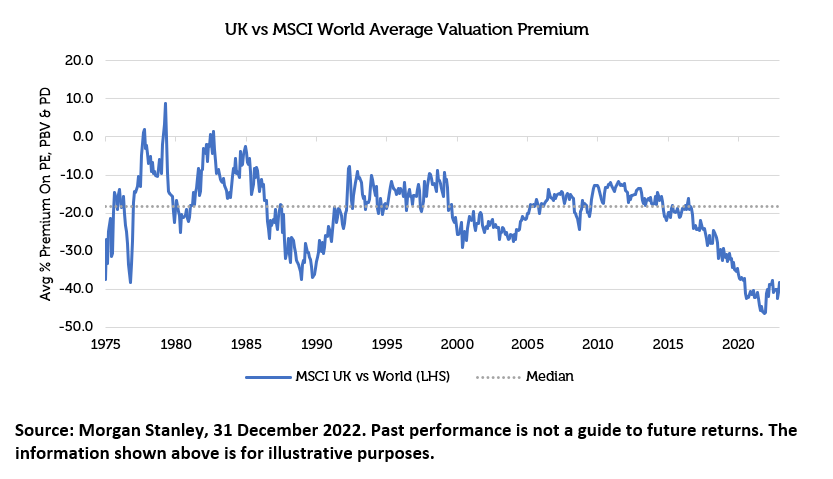
If you accept the earlier premise that starting valuation and subsequent returns are inversely correlated, then the UK should be an attractive place to allocate given that it has one of the lowest valuations relative to World markets for fifty years and is also one of the cheapest developed markets today.
2. Dividend yield
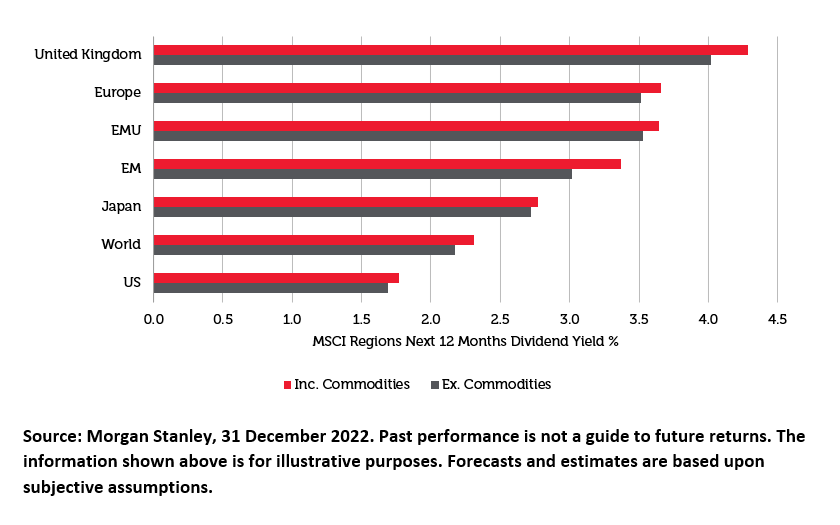
The UK offers one of the highest dividend yields of any market in the world and as readers of the Barclays Gilt Equity study will know, in the long run, dividend yield makes up about half of total returns.
3. Sector composition
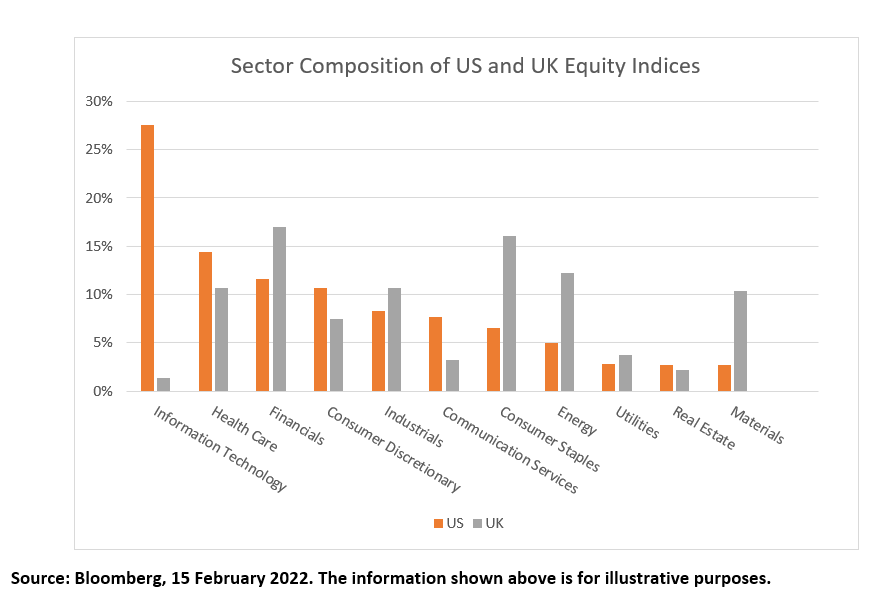
Whilst a low exposure to technology stocks and a high exposure to energy and mining might have been a headwind during the last decade, it is quite possible this becomes a tailwind in the future. Last year, for instance, the energy sector was +30% when NASDAQ was down 30%. Some strategists such as Russell Napier believe that the next decade will see a catch up in investment in productive assets such as gas fields and copper mines and less investment going in to yet another takeaway food delivery app.
Conclusion
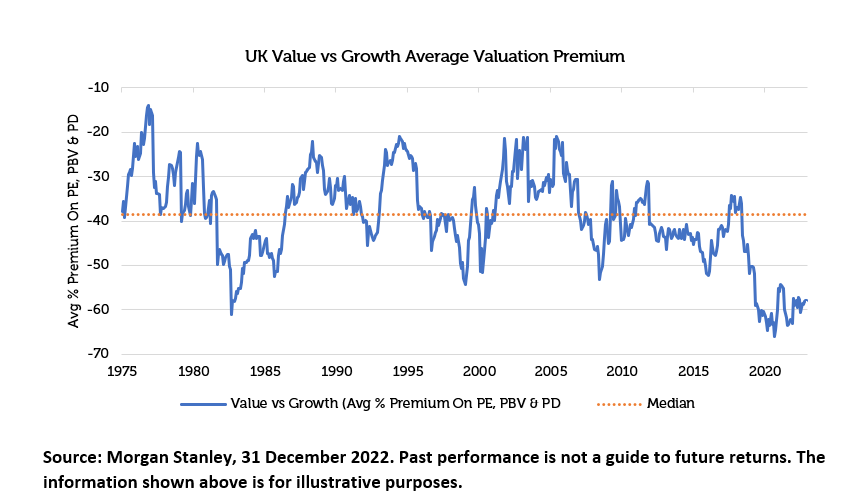
There is a good chance that most of the people reading this note will have no option other than to stick with the asset allocation policy recommended by their Investment Committee of being 1% underweight the US and 1% overweight the UK and hence having 68% of their equity exposure in ‘the sixth super-bubble in financial market history’ and only 5% in one of the cheapest markets in the world. But for those who have the freedom to stray from the benchmark, I would urge you to at least consider a sizeable allocation to the UK. Even better than buying the whole UK market would be buying the cheap part of it since value within the UK is still very cheap relative to growth as the chart below demonstrates. If nothing else, please stop selling UK equities!
Sources:
[1] S&P 500 total return, NASDAQ Index total return, FTSE 100 Index total return, 31 December 2021 to 31 December 2022, Bloomberg
[2] LET THE WILD RUMPUS BEGIN*By Jeremy Grantham, GMO Jan 2022
[3] UK’S AILING IMAGE PROMPTS BIG SWITCH AWAY FROM UK-FOCUSED EQUITY FUNDS WHILE HIGHER YIELDS TEMPT INVESTORS INTO BONDS, Calastone, Fund Flow Index, 6 February 2023
[4] Price change. Bloomberg, 30 December 1999 to 15 February 2023
[5] BP, 31 January 2023
[6] Bloomberg, 15 February 2023
Key Information
No investment strategy or risk management technique can guarantee returns or eliminate risks in any market environment. Past performance is not a guide to future results. The prices of investments and income from them may fall as well as rise and an investor’s investment is subject to potential loss, in whole or in part. Forecasts and estimates are based upon subjective assumptions about circumstances and events that may not yet have taken place and may never do so. The statements and opinions expressed in this article are those of the author as of the date of publication, and do not necessarily represent the view of Redwheel. This article does not constitute investment advice and the information shown is for illustrative purposes only.


