Investors have become familiar with the “Magnificent 7” US stocks that have been important contributors to index returns and comprise over a quarter of the benchmark S&P 500 weight (as at 31 October 2024). The MSCI Emerging Markets Index has an equivalent “Fab Four” stocks, sectors and countries that have come to dominate its composition and performance.
The “Fab Four” Companies: Alibaba, Samsung Electronics, Taiwan Semiconductor, Tencent – are they unstoppable?
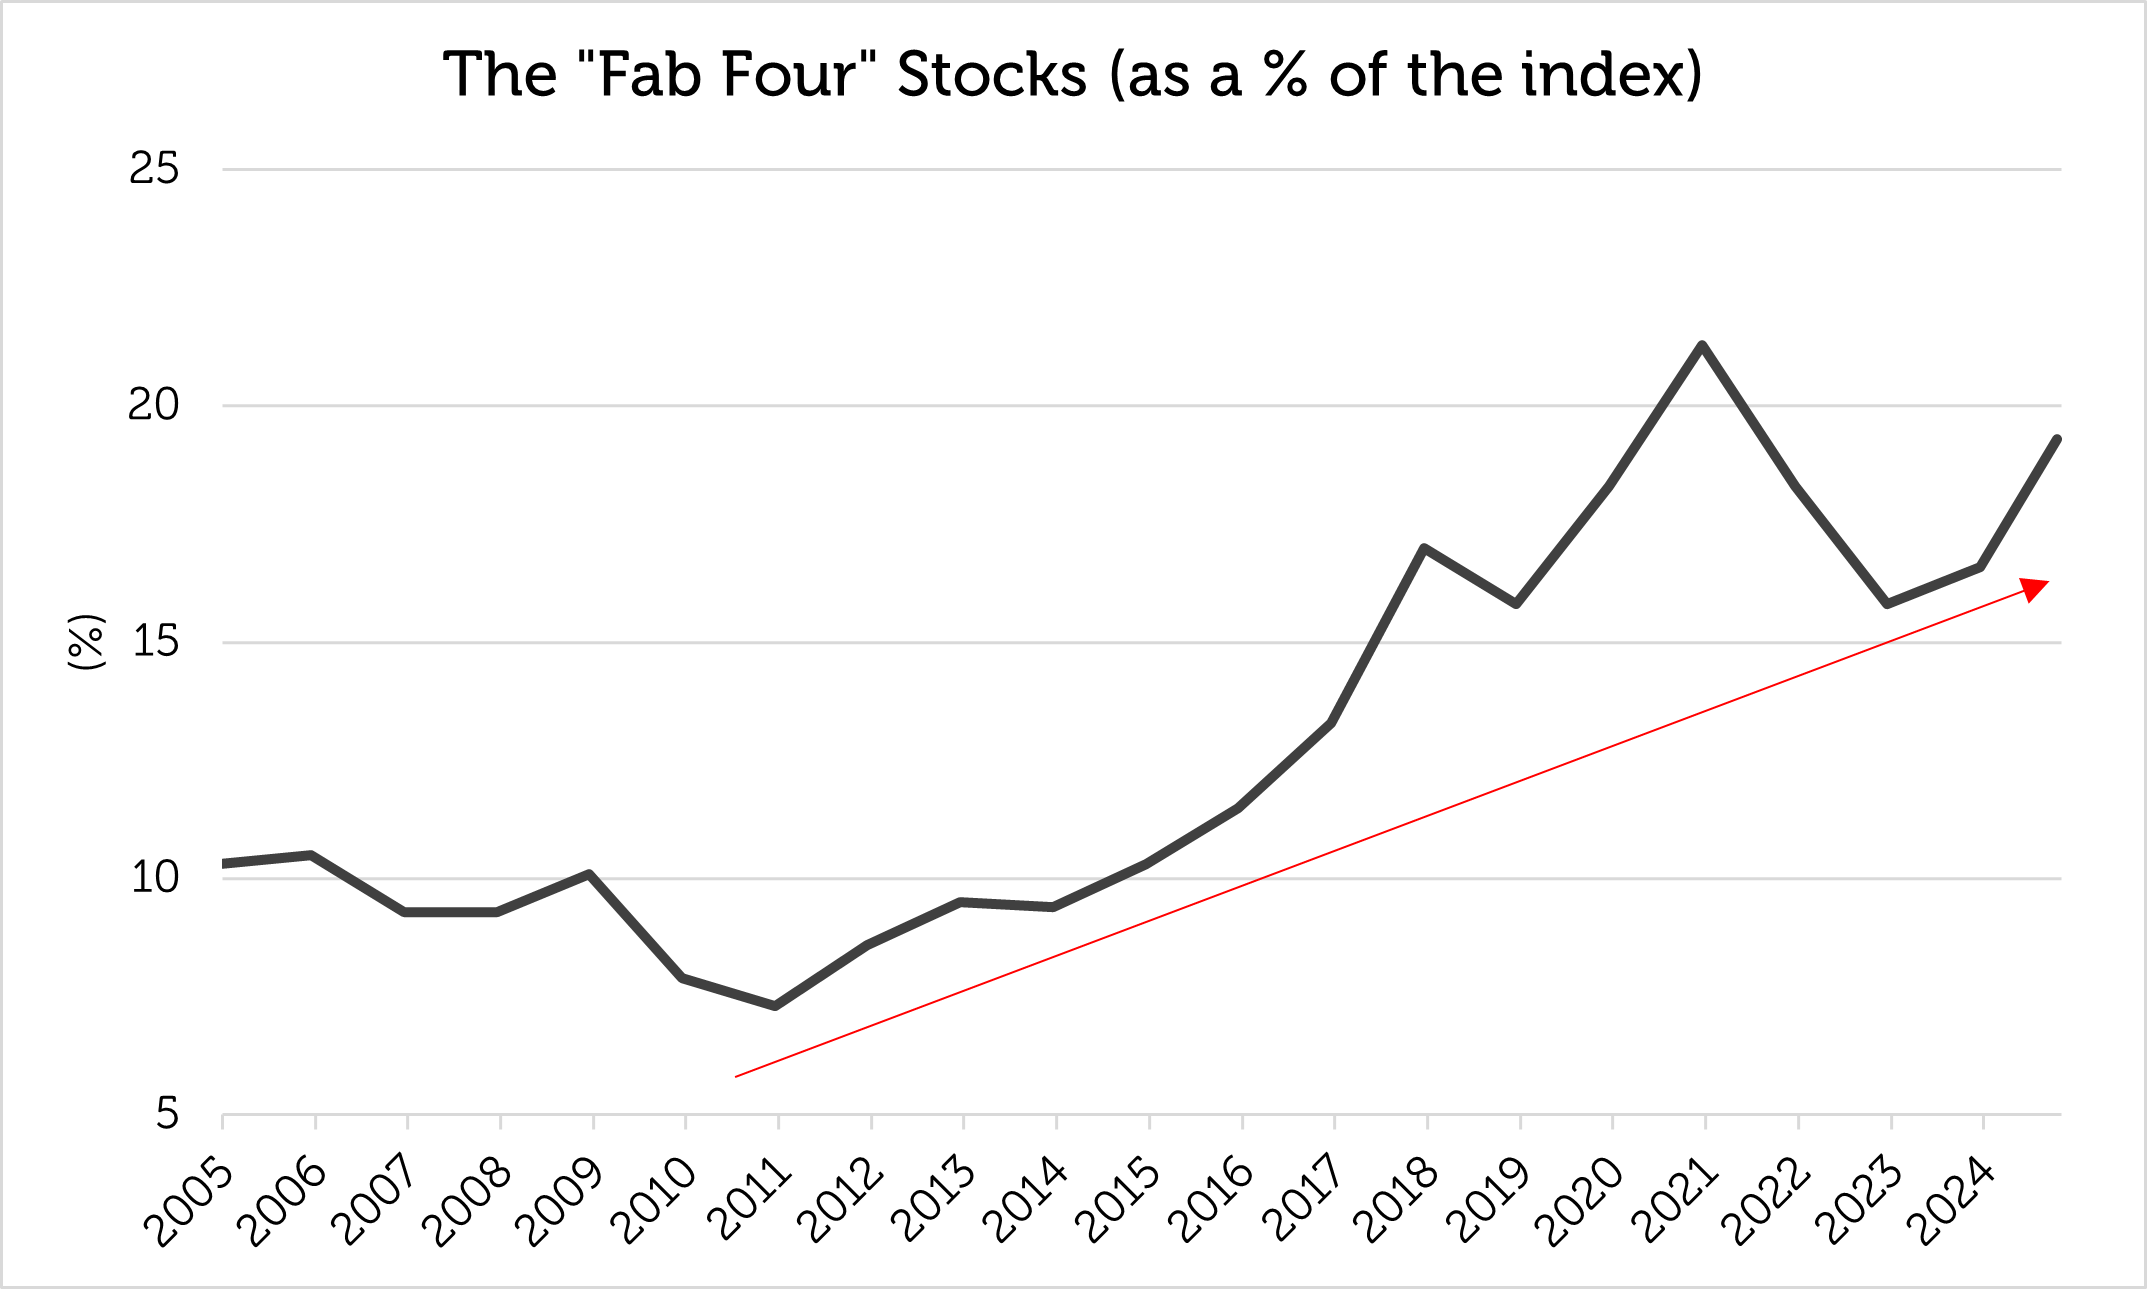
The largest four stocks in the MSCI Emerging Markets Index have increased their combined weight from 8% – 10% in the 2000s to 15% – 20% of the index in the 2020s and have been responsible for a significant proportion of its total return.
The same companies have occupied the top four slots in the MSCI Emerging Markets Index since June 2016: Taiwan Semiconductor Manufacturing (TSMC), Tencent, Samsung Electronics and Alibaba.

Source: Bloomberg, Redwheel as of 31 October 2024. Past performance is not a guide to future results.
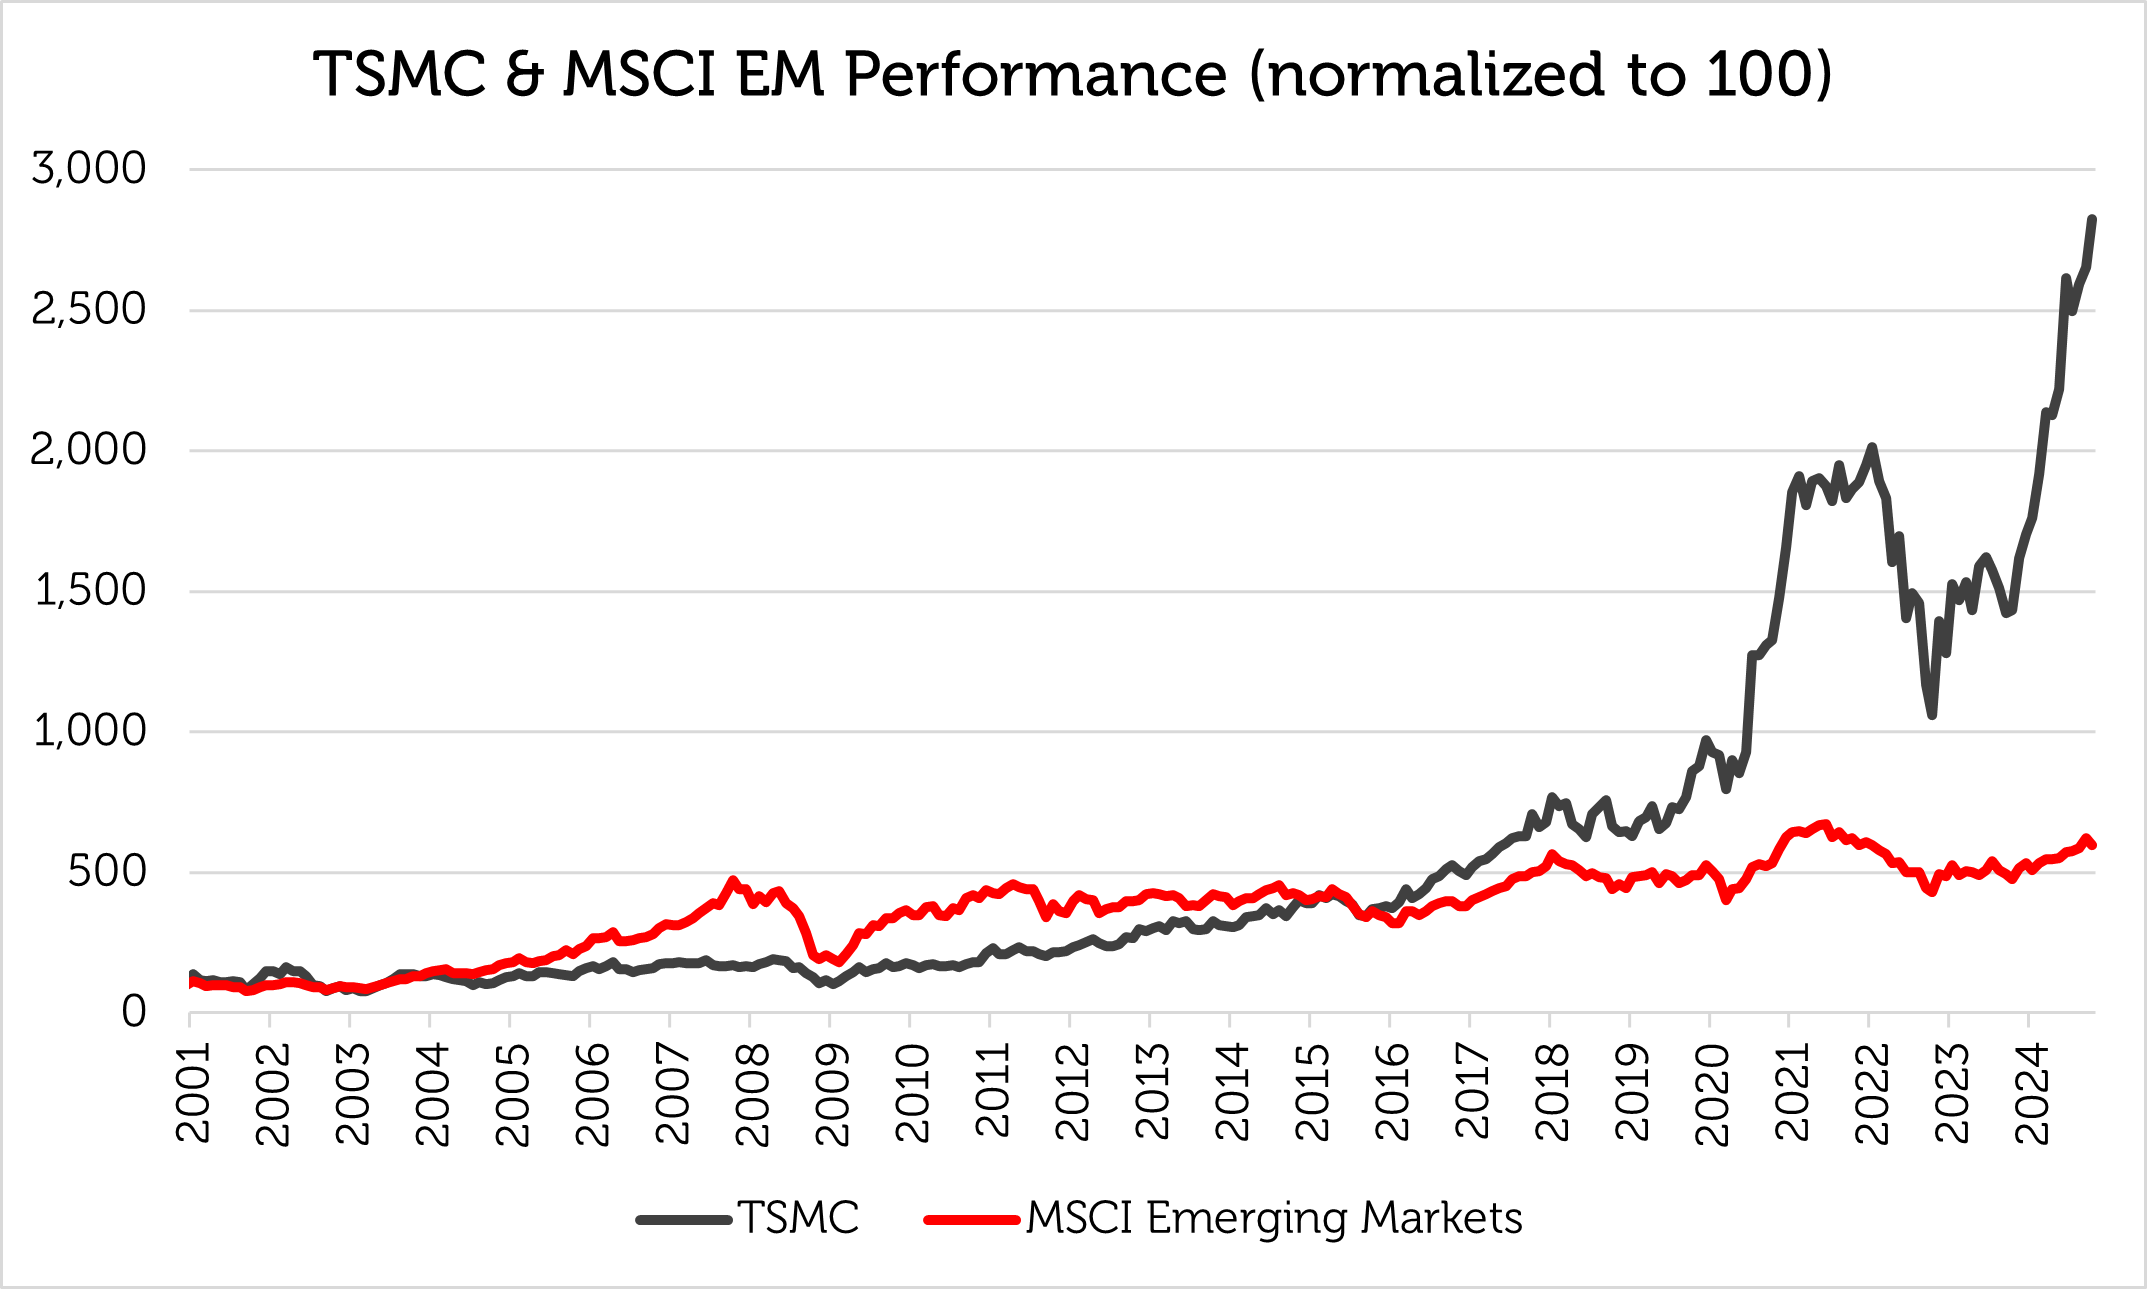
Taiwan Semiconductor, the largest of them, now accounts for c.10% of the index, equalling or even exceeding the relative size of Apple, Microsoft and NVIDIA in the Nasdaq Index. Since the beginning of 2001, Taiwan Semiconductor has outperformed the MSCI Emerging Markets Index by about 10% per annum. Up until 31 October 2024, Taiwan Semiconductor has accounted for approximately 35% of this year’s total return of the MSCI Emerging Markets Index. At the current weight of c.10%, it has become practically impossible for most fund managers to neutralize or exceed the weight of Taiwan Semiconductor while adhering to guidelines for concentration and diversification. Excessive size and the inability of fund managers to replicate an enormous index weight might indicate that a stock is approaching the end of its outperformance because of a potential lack of new buyers.

Source: Bloomberg, Redwheel as of 31 October 2024. MSCI Emerging Markets uses the MSCI Emerging Markets Net Total Return Index. Returns in US$. Past performance is not a guide to future results.
The “Fab Four” Countries: China, India, Korea, Taiwan – is EM now just Asia?
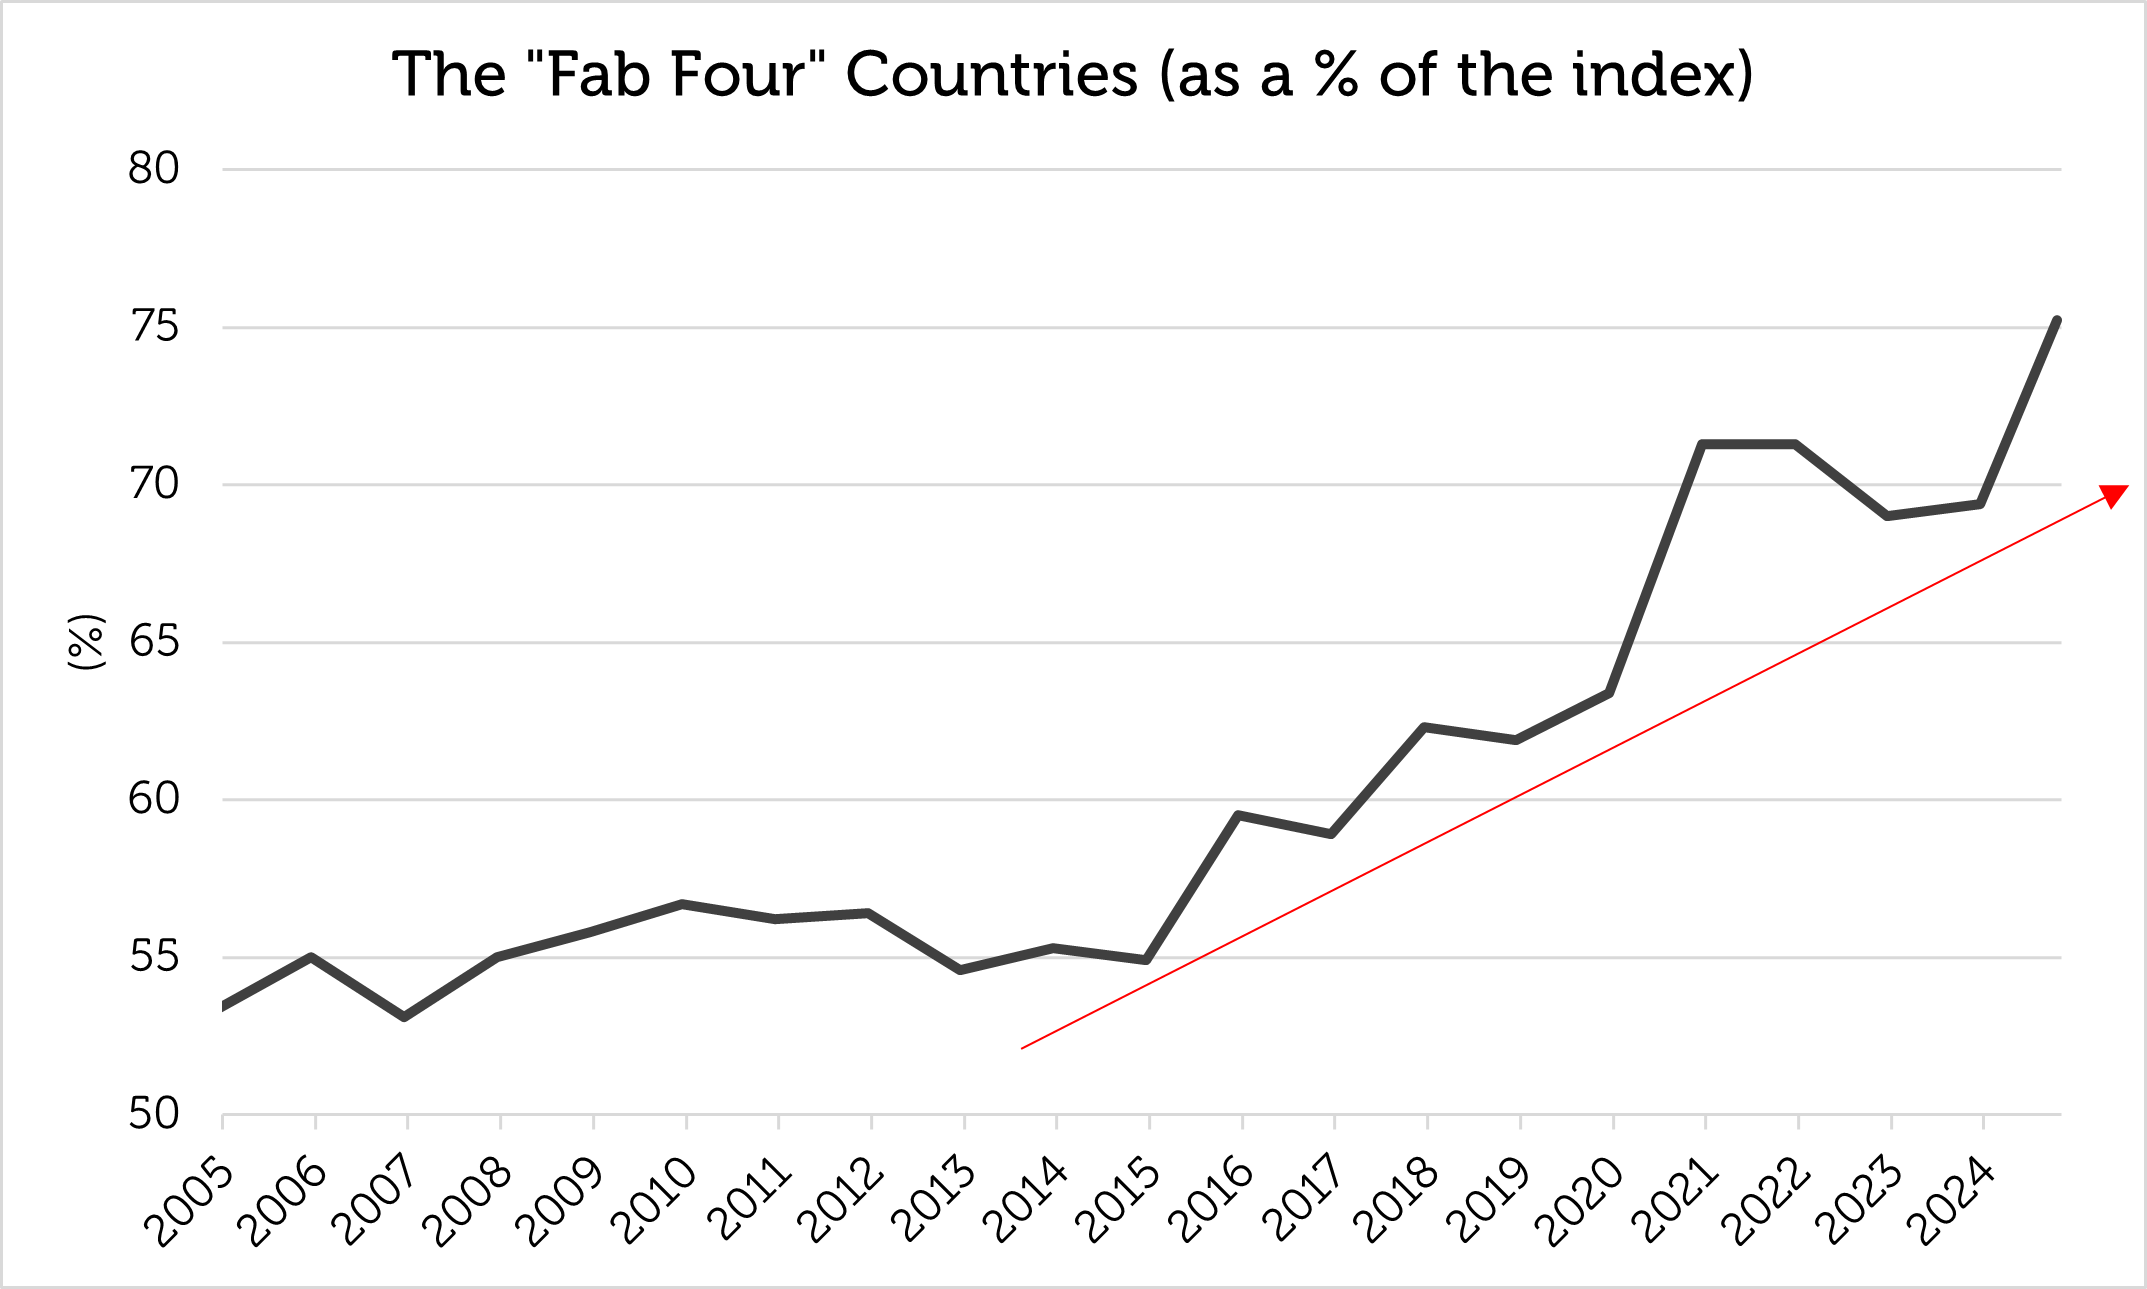
Country concentration mirrors stock concentration, with the same four countries dominating the index, their weight growing from the range of 50% – 60% between 2005 and 2017 to over 70% today (as at 31 October 2024): China, India, Korea and Taiwan. It has been almost ten years since a Latin American country (Brazil) has been in the top four, and nearly twenty years since an EMEA country (South Africa) has made an appearance. The concentration has become particularly pronounced since the mid-teens and means that the other 20 or so countries in the MSCI Emerging Markets Index account for an average weight of just over 1% each, making it difficult to achieve geographic diversification outside Asia.

Source: Bloomberg, Redwheel as of 31 October 2024. Past performance is not a guide to future results.
China has a uniquely large position, having risen from 6.8% of the MSCI Emerging Markets Index at the start of 2004 to an unprecedented 35.9% at the end of 2020, outperforming the index by just over 1% per annum along the way, but has underperformed by around 9% per annum since the end of 2020. China has dropped back to c.25% of the index but is still the largest country in the investable universe. Excessive weight of, perhaps, over one-third of the index might suggest that a single country is close to its maximum appeal with two dozen other countries from which to choose.
The “Fab Four” Sectors: Technology, Financials, Consumer Discretionary, Communication Services
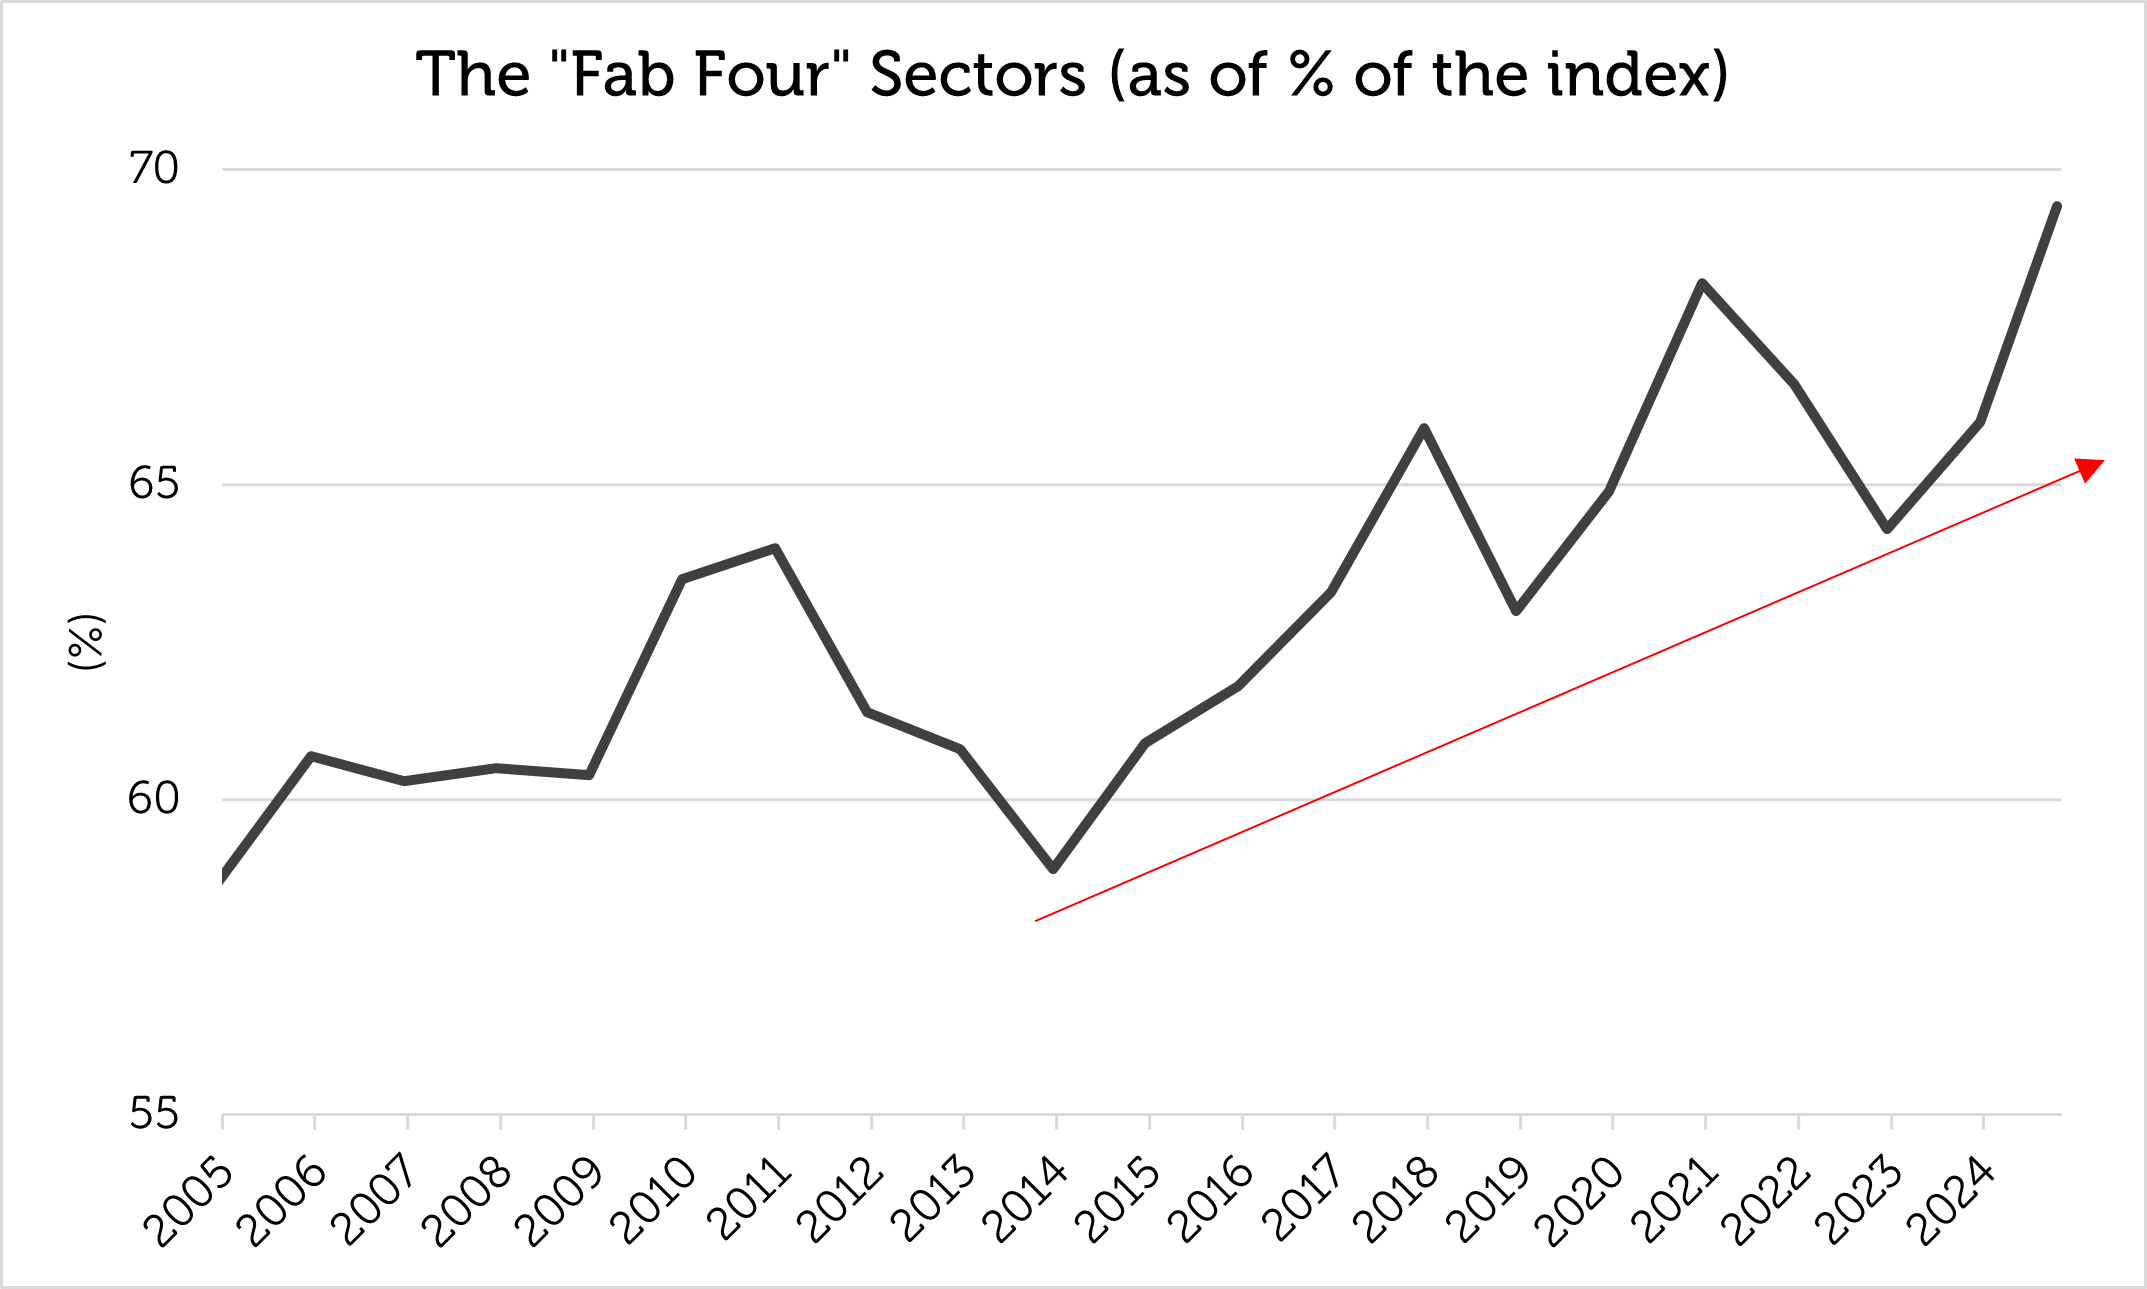
The “Fab Four” effect is less obvious by sector, the top four usually comprising around two-thirds of the index and the top two currently accounting for 47% of the index. Although the “Fab Four” sectors have been static, like countries for several years, Energy and Materials used to be significant weights during commodities’ bull cycles.

Source: Bloomberg, Redwheel as of 31 October 2024. Past performance is not a guide to future results.
What are the lessons of index concentration?
1.Being big is not as good as getting big – the biggest are not always the best
The size of a stock in an index is not a guarantee of future returns. In fact, size can be the enemy of returns. For example, of the “Fab Four” stocks at the peak of size concentration at the end of 2020, only Taiwan Semiconductor outperformed the index in the ensuing one and three years.

Source: Bloomberg as of 31 October 2024. Returns are in US$, periods >1 year are annualized. MSCI EM Index uses the MSCI Emerging Markets Net Total Return index. Past performance is not a guide to future results.
The same is true at the point of minimum size concentration; from 2011 (the point of lowest concentration), Samsung and Taiwan Semiconductor outperformed the MSCI Emerging Markets Index while Petrobras (a member of the “Fab Four” at that time) underperformed. Being a member of the “Fab Four” is no guarantee of being a hit.

Source: Bloomberg as of 31 October 2024. Returns are in US$, periods >1 year are annualized. MSCI EM Index uses the MSCI Emerging Markets Net Total Return index. Past performance is not a guide to future results.
What seems to matter is the market theme. For example, it was the Global Financial Crisis in 2008 that dethroned commodities, as Chinese growth decelerated in the 2010s and 2020s. And, while commodities have fallen from their peak, technology stocks have gained in importance globally because of the invention and adoption of digital content, e-commerce and artificial intelligence.
An important question is whether the technology sector can maintain market leadership. In the past, its relative performance has coincided with interest rate cycles. We believe a shift in market leadership occurs when there is a change in underlying economic and financial conditions. As the Federal reserve embarks on a rate-cutting cycle, market leadership might finally rotate away from technology stocks.
2. How big is too big? Is 10% a barrier for a single company, and 20% a barrier for the “Fab Four”?
There are nearly 1,300 companies in the MSCI Emerging Markets Index. Idiosyncratic risk, internal position limits and diversification requirements make it hard for investors to run materially overweight positions in single issues that reach 10% of the index, implying a possible lack of incremental buyers at such a large size.
In addition, the “Fab Four” stocks’ dominance peaked at 21% of the index in 2020 and has not yet regained that level, suggesting a possible ceiling on their combined weight and better potential returns elsewhere.
3.Financials and Technology have consistently grown; can Energy and Materials recover?
Financials and Technology have dominated index composition, often representing 20% – 25% of the index each. During the Super-Cycle of the 2000s, however, both Energy and Materials represented significantly higher weights in the index than they do today. A change in market dynamics is required for Energy and Materials to rebound, which might be caused by lower interest rates and a resumption of global growth led by China, India and other major emerging markets when interest rates decline.
4. Asia dominates; can India emulate China, and can EMEA / LatAm rebound?
The MSCI Emerging Markets Index has become less geographically diversified over the past decade with the “Fab Four” countries now accounting for 75% of index capitalisation. China is the archetype of index dominance, quintupling in size from 6.7% to 35.9% between 2004 and 2020. India has almost quadrupled in size, from 5.8% to 19% over the same period. India has the population, economic potential and high growth rate possibly to emulate the rise of China as a benchmark constituent.
EMEA and Latin America probably need a commodity upswing to rebound in the MSCI Emerging Markets Index. Brazil and South Africa were both “Fab Four” countries during the Super-cycle of the 2000s, and Brazil remained a “Fab Four” country until 2014. Because EMEA and Latin America have more representation in the Energy and Materials sectors than in the Technology sector, they have missed the technology boom and have been eclipsed by Asia.
5. What might cause a change in market leadership away from Asia and Technology?
A new “Fab Four” generation of countries, sectors and stocks can only occur with the passage of time and a change in macroeconomic drivers. Such a change may be on the horizon with lower interest rates and China’s recently announced economic stimulus that is likely to have an impact across the Emerging and Frontier Market universe.
On September 18th 2024, the Federal Reserve began a loosening cycle by cutting the benchmark rate by 50 basis points, which should encourage emerging market central banks to reduce rates as well. This could boost economic activity and contribute to a weaker dollar. On September 24th 2024, Chinese authorities announced measures to boost economic growth. As China’s domestic economy regains momentum, it should benefit the broader emerging market universe through higher demand for commodities used in manufacturing. We believe that these factors can create strong tailwinds for EM and create the potential for a shift in market leadership away from technology towards commodity producers in EMEA and Latin America.
Within our investment process we have identified several themes we see as drivers for commodity demand: Energy Transition, Urbanization, and Reshoring and Defence. We combine a deep understanding of the themes shaping Emerging and Frontier Market economies with fundamental analysis of the companies who are able to harness the opportunities these themes represent.
- As part of the Energy Transition and Green Metals theme, we have identified several commodities that should see their prices rise over the coming years due to supply/demand imbalances, including copper, nickel and other industrial metals. Demand should remain robust for green metals due to numerous drivers including electric vehicles, data centres, and the renewable grid buildout. For example, BHP expects that copper demand will rise significantly due to data centres, which should grow to 6-7% of the overall demand from around 1% of demand today (Source: BHP warns AI growth will worsen copper shortfall). We are positioned in mining companies that should see earnings accelerate as global demand for commodities rises and they expand their production capacity.
- Under the Urbanization theme, we have identified Chinese property firms that are well-positioned for earnings growth as the industry recovers. Real estate development should continue in other regions including the Middle East and Southeast Asia where incomes are increasing, driving urban growth. We expect that property developers should see sales accelerate as rural populations migrate toward urban centres in pursuit of higher wages. Broader financial inclusion, such as wider mortgage availability, is helping to facilitate the urban transition.
- As part of the Reshoring and Defence theme, we seek companies that should experience sales and profit growth as companies strategically relocate manufacturing facilities to closer and friendlier jurisdictions, and governments boost spending on defence in response to Russia’s invasion of Ukraine. Lower interest rates should lower the cost of borrowing for companies, encouraging investment in nearshoring initiatives. These are commodity-intensive initiatives.
As we have shown, size is not necessarily a pre-determinant of returns and we believe a thematic approach which seeks to identify the long-term growth drivers in Emerging and Frontier Markets can uncover a compelling set of bottom-up investment opportunities that looks beyond market dominance.
Key Information
No investment strategy or risk management technique can guarantee returns or eliminate risks in any market environment. Past performance is not a guide to future results. The prices of investments and income from them may fall as well as rise and an investor’s investment is subject to potential loss, in whole or in part. Forecasts and estimates are based upon subjective assumptions about circumstances and events that may not yet have taken place and may never do so. The statements and opinions expressed in this article are those of the author as of the date of publication, and do not necessarily represent the view of Redwheel. This article does not constitute investment advice and the information shown is for illustrative purposes only.

