The Inuit people are said to have 50 words for snow, and in Ireland, we potentially have as many ways of describing rain. On the south-west coast, where I grew up, it rains on average 242 days of the year… It often felt like more. The same source says even the driest month, June, on average receives 16 days of rain. This summer was one to keep averages high; my father tells me that it started raining at the end of June and stopped on the Assumption (August 15th). His assessment is backed up with July being declared the wettest on record for the country. In this context, a soft day, a mist, or a slight drizzle isn’t therefore considered ‘wetting’ rain.
The upside for me was that I wasn’t in the country, I was with my wife’s family in Sweden, which was also very wet, but there, it wasn’t my fault.[1] The Swedish Meteorological and Hydrological Institute (SMHI) said “For some [weather] stations, August 2023 was also the wettest month regardless of the time of year.” Over the bridge from Skåne, Denmark suffered its wettest July since measurements began in 1874. Storm Hans meant Norway was a similar story, while if you holidayed here in the UK, you got the same. You get the point; it was a very wet summer.
How do we process this information in the context of climate change, while being fed shock headlines by the media, like the Mirror’s front page in the summer of 2021, “We’re killing Earth”. What’s more, these media-hyped records are often a type of data mining.
As the definition goes, climate is what you expect, weather is what you get. So, what should we expect given what we are getting?
The Met Office gives a very clear explanation of changes in rainfall intensity extremes. They present three indices to capture such changes: the wettest day of the year, the amount of rain falling in heavy events, and the fraction of the total annual precipitation coming from heavy events. All three indices show gentle increases since the beginning of the 20th Century, with a noticeable acceleration from mid-century. The IPCC Climate Change 2021 report stated that “[t]he frequency and intensity of heavy precipitation events have increased over a majority of land regions with good observational coverage (high confidence)”[2]. It continues that “[i]n Europe there is robust evidence that the magnitude and intensity of extreme precipitation has very likely increased since the 1950s.” It appears from sober analysis that we are indeed getting more and will get more intense rainfall in the coming decades.[3]
We are all well familiar with the consequences: built-up areas struggle to drain water fast enough, and flash flooding damages houses, cars, roads, and other infrastructure. It impacts the environment as well as endangering lives. Farmers struggle to sow or harvest crops. One very topical issue is the sewage discharges into our waterways and onto our beaches from storm overflows, these discharges are a major environmental problem, as well as a political one. Tideway, the company delivering the new London super sewer, estimate that 8 billion toilet flushes are released into the Thames every year. The super sewer, when operational in 2025, is designed to solve this problem. Without it, and with the increase in extreme rainfall events that are expected due to climate change, the problem would get much worse.
As the planet warms, the intensity, frequency and duration of extreme weather events, such as heatwaves and heavy rainfall, are expected to increase. Ireland had the wettest July, but also the driest June and a stormy August. While Northern Europe suffered heavy rain, Southern Europe suffered extreme heat. It is all a reminder that we must continue to work urgently on mitigating climate change, and to adapt to the changes that are already underway. We don’t need the dramatic headlines; we have the sober analysis and some real time observations to keep us very much focused on the task at hand.
*Written as the Met Office warned that the country could experience six days of 30C heat for the first time in September.
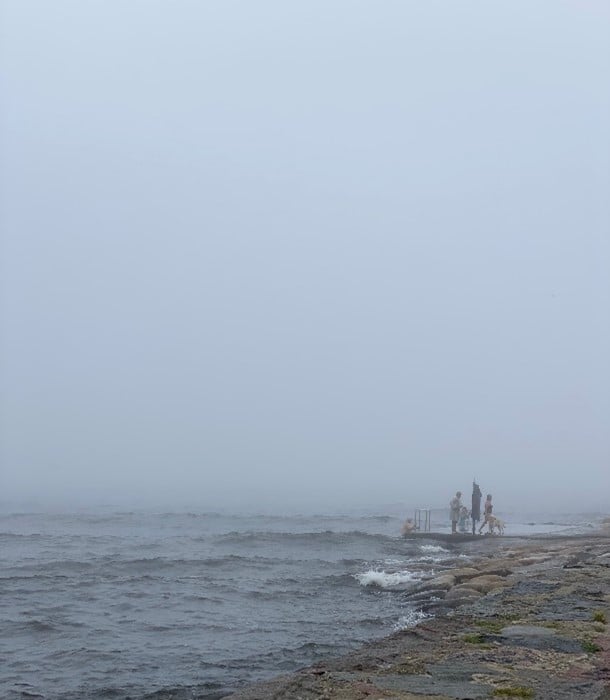
Picture 1: Teahan Family holiday, Skåne, Sweden August 2023
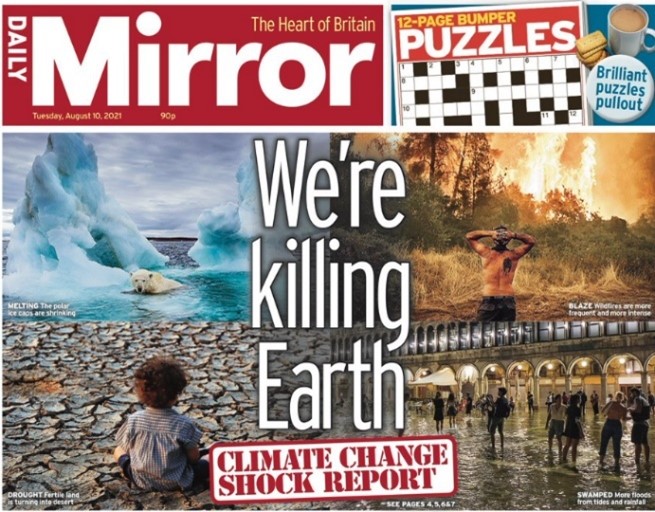
Picture 2: Mirror newspaper reporting on floods, wildfires, drought and melting icebergs, August 2021. The information shown above is for illustrative purposes.
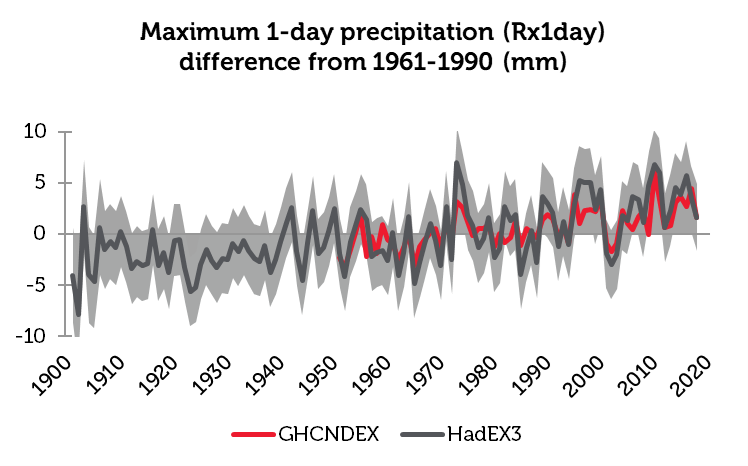
Chart 1 : Met Office, as at 2020. The information shown above is for illustrative purposes.

Chart 2: Met Office as at 2020. The information shown above is for illustrative purposes.
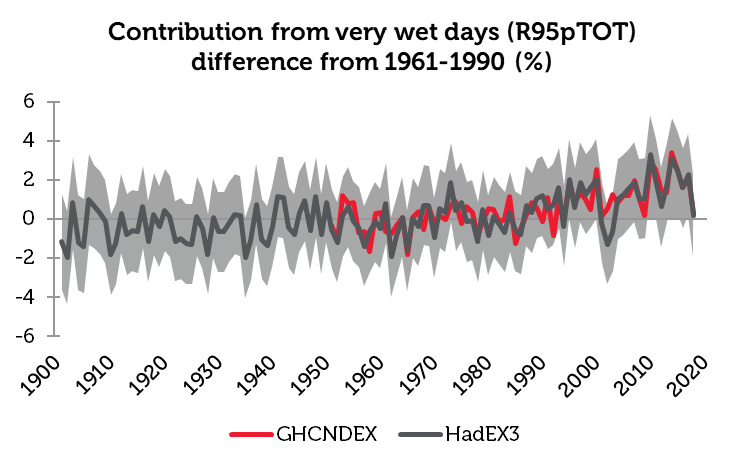
Chart 3: Met Office as at 2020. The information shown above is for illustrative purposes.
Sources:
[1] I should add, I love Sweden, we had some nice sunny days, and we had an amazing holiday #peace.
[2] https://report.ipcc.ch/ar6/wg1/IPCC_AR6_WGI_FullReport.pdf
[3] https://report.ipcc.ch/ar6/wg1/IPCC_AR6_WGI_FullReport.pdf
Key Information
No investment strategy or risk management technique can guarantee returns or eliminate risks in any market environment. Past performance is not a guide to future results. The prices of investments and income from them may fall as well as rise and an investor’s investment is subject to potential loss, in whole or in part. Forecasts and estimates are based upon subjective assumptions about circumstances and events that may not yet have taken place and may never do so. The statements and opinions expressed in this article are those of the author as of the date of publication, and do not necessarily represent the view of Redwheel. This article does not constitute investment advice and the information shown is for illustrative purposes only.

