The concept of risk should be simple and straight forward, yet it repeatedly seems to get twisted upside down and back to front, causing bubbles and crashes. For investors, it is the coupling of human behaviour and risk systems that are the root cause of such outcomes. Today, when seven stocks account for 20% of global indices[1], risk seems to have been turned on its head yet again.
As excessive valuations and concentration risk in global benchmark indices continue to increase, how can equity investors navigate this environment? We believe the answer lies in accepting what you can control and what you can’t. Investors can’t control valuations, but they can target income in market conditions where dividends have historically made outsized contributions to total returns.
Three quotes that explain how risk can be turned on its head
For investors, risk is inseparable from return; both are predicated on an unknowable future. Hence, the risk-free return is usually the lowest: the greater the certainty of future outcomes, the lower both the risk and return. In general, accepting the risk of an uncertain range of future outcomes is necessary to generate a return higher than the risk-free rate. However, it does not guarantee such a return – that’s why it is called risk! Therefore, one should strive in an investment process to allocate capital for a range of future outcomes where the probability is skewed towards a favourable return.
Naturally this won’t always result in a positive outcome. We get things wrong and/or it can take longer to generate a return. The challenge obviously is to get it right more often than not. However, there can be times when, despite leaning the statistics in one’s favour, performance can remain sub-par for a period. A coin toss is 50/50 but you can still get a run of heads.
Howard Marks wrote, “…human nature makes it hard for many to accept the idea that the willingness to live with some losses is an essential ingredient in investment success”. [2]
Within active equity management, relative underperformance is “hard for many to accept” despite being “an essential ingredient in investment success”. The reasons why are multi-faceted, yet at the kernel of it is a catch created by our own industry. Active managers assume risk in order to generate decent returns. Clients are then told to measure the success of this risk return approach by comparing the outcome to a benchmark. It is therefore assumed that active managers take risk while the benchmark is risk free.
Most of the time this makes sense. Within equities, markets are typically rational and accurate at allocating capital, and the risk reward is skewed favourably. However, there are periods where irrationality can take a hold.
Benjamin Graham, mentor to Warren Buffett, said: “In the short-run, the stock market is a voting machine, in the long-run, it is a weighing machine”.
The “weighing” of risk reward becomes replaced by emotion or “voting”. It is usually at these times of excessive greed or fear that the benchmarking system turns on its head.
In extreme conditions, underperformance becomes magnified and it becomes “hard for many to accept the idea …. to live with some losses”. When the herd mentality creates a concentrated market, being different from such a majority feels increasingly wrong. It’s at these times, when pressure on fund managers is greatest, that career risk is highest.
It’s also during these periods that risk systems are most likely to drive investors to move closer to the herd, to the benchmark, in order to reduce the risk of further relative “losses”. Yet it is exactly at these times that the understanding of risk is turned on its head. Given the extreme valuations in the benchmark, it is there that the risk is greatest. Despite this, investors are encouraged by emotion and risk systems to invest in the benchmark in an attempt to reduce risk!
In the words of Oscar-winning actress Geena Davis: “If you risk nothing, then you risk everything”. By trying to reduce risk, you generally succeed only in increasing it.
Global equity markets carry considerable risk
Right now, equities are a prime example of this inverted appreciation of risk.
Once again, the market has become concentrated. A narrow part of the market has created a highly concentrated market. US equities now account for c.70% of the MSCI World index, up from c.30% back in the late 1980’s (when as an aside, Japan was c.45% of the MSCI World and is now c.6%!). [3] Within that US dominance, the Magnificent 7 account for c.20% of the MSCI World on their own. Of the S&P 500, the Mag 7 [4] account for c.30% of the index [5], yet only account for 18% of the index’s earnings, evidencing the premium valuation applied to these stocks. [6]
The chart below illustrates how the market has historically disregarded valuation at extremes (when “voting” takes over), increasing both concentration and risk in the benchmark.
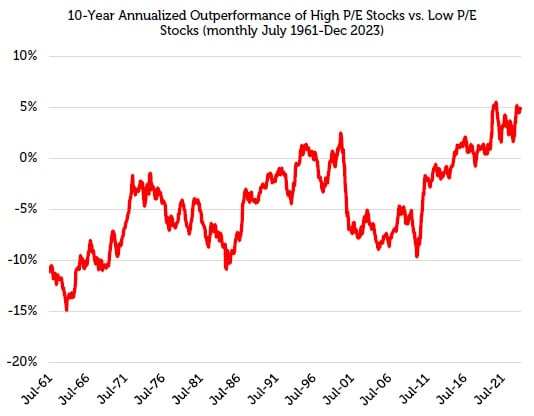
Source: Ken French Data Library, CRSP database, 07/31/1961 – 12/30/2023. Stocks separated into Top Price/Earnings minus Bottom Price/Earnings. The information shown above is for illustrative purposes. Past performance is not a guide to future results.
Whether it’s the Nifty Fifty bubble in the 1970’s or the Magnificent Seven bubble today, the market has repeatedly marched a narrow cohort of the market to excessive valuations, only to see them crash. Yet, it is at these highs and lows, when emotion is dominant, that the pressure is greatest to join the herd.
During times of exuberance, when valuation is no longer a concern, investors that follow the benchmark are practically betting on rising valuations. The valuation multiple reflected by the benchmark moves significantly over time, as illustrated by the chart below.
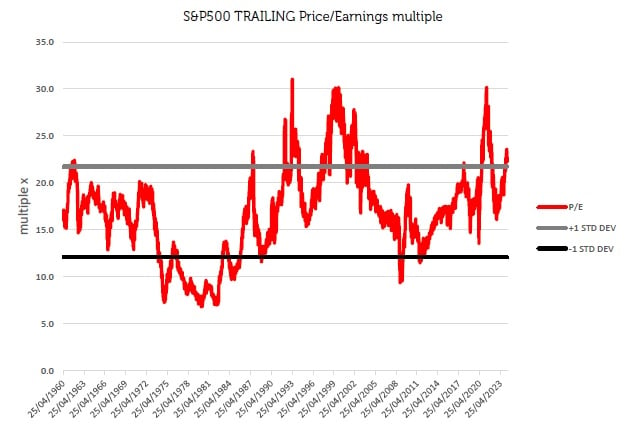
Source: Bloomberg, Redwheel 22 April 2024. The information shown above is for illustrative purposes. Past performance is not a guide to future results.
The chart shows that the aggregate price to earnings (P/E) of the S&P 500 since 1960 has spanned a low of 8x to a high of 30x. Today the S&P 500 is above one standard deviation from the average over this period, driven primarily by just seven stocks. The valuation can be influenced by an almost inexhaustible list of things – sentiment, psychology, media, macro events, interest rates, politicians, wars and many more – but it can’t be controlled.
Despite this, at the extremes when the pressure is greatest to join the herd, investors are simply betting that the valuations will keep rising. Effectively, they are betting on something that is beyond their control, which continues to increase risk while they attempt to reduce it.
The chart below demonstrates this well. It shows the maximum drawdowns and upswings in the Redwheel Global Equity Income Strategy (USD) since re-launch in December 2020, compared to the same for the MSCI World index (USD).
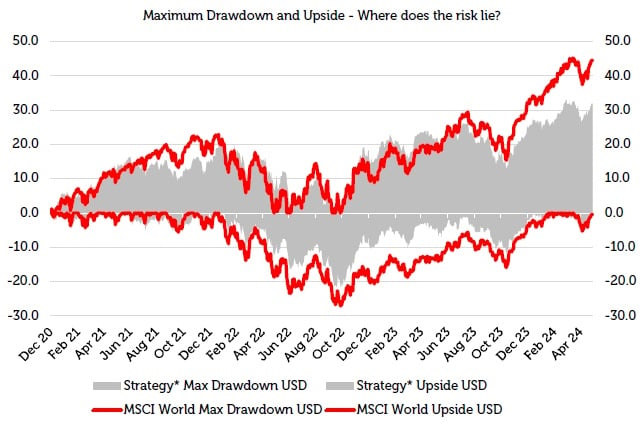
Source: Bloomberg, Redwheel 22 April 2024. The information shown above is for illustrative purposes. Past performance is not a guide to future results. *Please see the disclaimer at the end of this document for further information on the Representative Portfolio.
It shows clearly that the moves have fluctuated more in the index than in the strategy. For the most part, the strategy lags during the upswings, but outperforms during the drawdowns. Yet, because the benchmark is seen as lower risk by risk management systems, and due to our own encouragement as an industry, adhering to the benchmark to reduce risk after a period of relative underperformance typically achieves the complete opposite.
Focus on what you can control: durable dividends
The chart below shows how the periods where emotions (“voting”) dominate fundamentals (“weighing”) can drive changes in the composition of total returns.
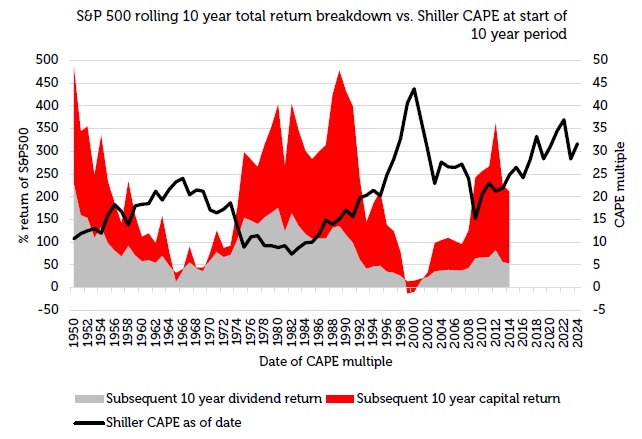
Source: Source: Bloomberg for S&P500 / Shiller Cyclically Adjusted Price to Earnings Ratio (CAPE) www.multpl.com/shiller-pe/table/by-month 31st December 2023. The information shown above is for illustrative purposes. Past performance is not a guide to future results.
The chart shows the rolling 10-year returns (USD) for the S&P 500. One can see that the composition of the total return over the rolling 10-year periods changes meaningfully. Sometimes capital return dominates, sometimes the dividend return.
The capital return is driven by earnings growth and the multiple applied to those earnings (valuation), which as discussed earlier, are beyond investors’ control.
However, the dividend return can be controlled. Active managers can invest in companies that aim to deliver durable dividends. Those dividends can then be reinvested to compound a return to drive the total return over time.
Of note from the chart above, is that the cycle of the composition of total returns over rolling 10-year periods tends to correlate with the current valuation (Shiller Cyclically Adjusted P/E – CAPE) at the start of the period. The higher the starting valuation, the greater the probability that the next 10 years’ total return will be driven by the dividend component, the lower the starting valuation and it is the capital that will likely dominate.
Thus, in the current market, where valuations are high, where the last 10-year period has been driven by capital gains, where concentration has once again peaked, many investors are being encouraged by emotions and risk systems to herd into the most uncontrollable, more volatile aspect of total returns to reduce risk!
Instead, we believe investors should be focusing upon what is achievable, what is within their control: durable dividends, compounded over time. The less volatile path over time. This is what the Redwheel Global Equity Income Strategy is focused on to deliver robust total returns over time. We focus on what we have a degree of control over: dividends and the yield we get on them.
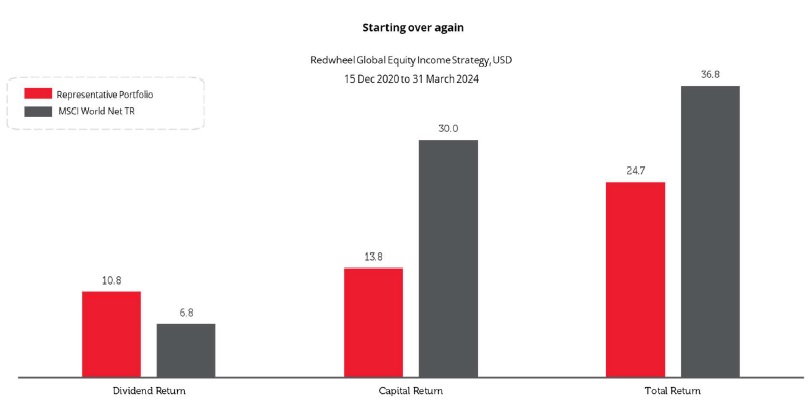
Source: Redwheel, Bloomberg, 31 March 2024 ,USD
Past performance is not a guide to the future. The price of investments and the income from them may fall as well as rise and investors may not get back the full amount invested. *Please see the disclaimer at the end of this document for further information on the Representative Portfolio.
Dividend yields should drive total returns from here
Since resuming the strategy at Redwheel, already the income contribution is greater than the market[1], despite compounding that income at a far lower rate than the market. [7] That is because of the higher starting yield. Given where risk really resides today, we believe that over time, the capital return element of the strategy will normalise in line with the market, allowing the compounding of dividends yields to drive long-term outperformance.
Today’s relative losses reflect our “willingness to live with some losses [as] an essential ingredient in investment success”. However, it is precisely at times like today when it is most appropriate to invest in a strategy like ours that focuses on what can be controlled, rather than the benchmark, where risk has been turned on its head.
Sources:
[1] Source: Factset end of March 2024.
[2] Howard Marks, Fewer Losers, or More Winners? Memo September 2023.
[3] Source: Factset end of March 2024.
[4] Microsoft, Amazon, Google (Alphabet), Tesla, Facebook (Meta), Nvidia and Apple
[5] Source: Factset end of March 2024.
[6] Source: Factset end of March 2024.
[7] MSCI World Net TR index
Key Information
No investment strategy or risk management technique can guarantee returns or eliminate risks in any market environment. Past performance is not a guide to future results. The prices of investments and income from them may fall as well as rise and an investor’s investment is subject to potential loss, in whole or in part. Forecasts and estimates are based upon subjective assumptions about circumstances and events that may not yet have taken place and may never do so. The statements and opinions expressed in this article are those of the author as of the date of publication, and do not necessarily represent the view of Redwheel. This article does not constitute investment advice and the information shown is for illustrative purposes only.
Representative Portfolio
Portfolio characteristics, top ten holdings, sector allocation, country allocation, attribution, volatility, yield, dividend and ESG information are based on a representative portfolio, which is TM Redwheel Global Equity Income Fund.
Redwheel believes that precisely this account within the strategy most closely reflects the current portfolio management style for the Redwheel Global Equity Income Strategy. Portfolio holdings are subject to change without notice. The information shown is for illustrative purposes only and is not intended to be, and should not be interpreted as, recommendations or advice.


