Exposure to balanced convertible strategies have historically offered a useful tool in strategic asset allocations; however, recent performance has been disappointing in relation to both investor expectations and the historical observations experienced in more normalised rate environments.
We believe that the current environment, driven significantly by higher rates and macroeconomic uncertainty, heralds a new era of returns for the asset class and in particular the balanced approach.
Return of the balanced approach
The convertible asset class can provide a benefit within asset allocation portfolios because as equities rise, the asset class becomes more equity-like; however, as equities decline, it becomes more bond like. In effect, convertible bonds may be considered an automatically adjusting asset allocation product and the degree of this adjustment can be defined as the convexity of the asset class.
Typically, the convexity is highest where the equity sensitivity of the portfolio is around 50% participation to equity market moves, otherwise defined as a 50% delta. Balanced exposure very simply signifies optimising for the convexity and adjusting the portfolio to ensure it remains close to a 50% delta. This is achieved by selling positions that start to exhibit higher equity sensitivity in a rising market and rebalancing into lower delta names; or in a declining market, selling positions which become more bond-like in favour of slightly higher delta names.
While the theory above sounds compelling, recent evidence has not yielded the desired returns, and we infer this has largely been due to three main factors: 1) lack of income, 2) unidirectional markets with little volatility, and 3) narrow equity leadership.
All three factors were driven by the macroeconomic environment that prevailed during much of the last ten years, dominated by quantitative easing, low interest rates and excess liquidity bolstering equities.
1) Asset class income dynamics
Due to the ultra-low interest rate environment prior to this last year, a large portion of convertible issuers had come to the market with 0% coupon bonds. For convertible bonds, generally, and balanced funds, particularly, this proved to be a difficult development, as an important component of returns was lost.
Given that balanced funds tend to forego upside by trimming delta, a lack of income compensation significantly reduced upside in rising markets while also not mitigating downside in declining markets. Balanced funds lost out to higher delta funds, which were able to benefit from higher levels of equity participation and had low opportunity costs of not being exposed to convertibles with more fixed income characteristics – owing to the absence of income.
As a very simplistic example, in a market that rises or declines by 10%: a convertible exposure without income with a 50% participation to that market provides a +5% or -5% return. Just the simple introduction of a more normalised income where coupons are closer to 2 to 2.5% on average, provides a more asymmetric profile of potential returns:
Equities | 50% Delta | 50% Delta + normalised coupon |
|---|---|---|
10% | 5% | 7.5% |
-10% | -5% | -2.5% |
*Please note the above illustration does not account for Gamma (convexity) or Theta (time value) Source: Redwheel: hypothetical scenario using the greeks. The information shown above is for illustrative purposes.
The current rate environment has provided a profound change in quality and structure of new deals, with the majority of new issuance during 2023 coming from Investment Grade and upper High Yield-rated issuers, with the average coupon in the range of 3.5 to 4% (source: Redwheel/Refinitiv as at 31st Oct 2023).
We think this new dynamic of higher coupons will continue and new issuance will remain elevated, as many companies are turning to convertible bond markets to reduce their cost of capital. In return for a bondholder call option, issuers achieve a sizeable coupon discount versus corporate straight-debt markets, hence providing a fundamental reason for companies to continue to issue convertible debt.
2) Undirectional markets
A consequence of the ultra-low interest rate environment has been the relentless rally – and subsequent momentum – in riskier assets. In recent years, we have seen significant appreciation across growth equites, high yield bonds, private equity, real estate, Bitcoin and “Meme” stocks, to name a few.
Whilst we acknowledge some of these rises may be warranted to an extent – owing to innovation and unique business models – we also believe some market moves were fuelled by the inefficient use of excess liquidity and cheapness of capital.
Associated with these unidirectional moves was a stubbornly low volatility environment. This lack of volatility has been detrimental to convertible investors and in particular, balanced investors, who are essentially forgoing momentum to remain balanced. This is particularly difficult when combined with the lack of income described above.
Additionally, balanced investors tend to have more exposure to volatility which has proven not to be beneficial given the depressed valuation of volatility. We note that convertibles generally tend to perform better versus equites in periods of higher volatility as shown in the table below.
VIX Average | Equities | Convertible Bonds | |
|---|---|---|---|
January 1999-January 2004 | 24.1 | -2.3& | 23.2% |
January 2004-June 2005 | 14.7 | 12.8% | 1.2% |
June 2005-July 2007 | 12.7 | 47.2% | 29.3% |
July 2007-August 2008 | 23.0 | -17.1% | -10.4% |
August 2008-December 2009 | 36.4 | -8.7% | 0.4% |
December 2009-December 2012 | 21.4 | 19.6% | 16.2% |
December 2012-August 2014 | 13.8 | 35.2% | 18.4% |
August 2014-December 2015 | 16.1 | 2.8% | 3.4% |
February 2020-October 2020 | 33.3 | 6.9% | 10.5% |
Source: Bloomberg, Redwheel (date range 01 Jan 1999 to 29 Oct 2020): VIX, MSCI World, Refinitiv Global Focus Hedged. Past performance is not a guide to future results.
It is our belief that as we enter a more normalised and higher rate environment, volatility will increase, compensating balanced investors and rewarding the conviction of remaining balanced.
3) Narrow equity leadership
Over the last 8 years, we have witnessed very prominent narrow leadership with a small component of names contributing to a large proportion of equity gains, from the “FAANG” stocks emerging in 2016, to the most recent “Magnificent 7”.
This narrow leadership has had a detrimental effect on the relative performance of convertibles, by virtue of the asset class having very little exposure to such names and mega-cap stocks, generally. While determining with complete certainty why a small handful of names have had such a profound impact on overall equity indices’ performances may be difficult and subjective, we do note the following possibilities.
Many of these companies are strong, well-managed companies which deserve to trade at a premium, however we also believe that the abundant liquidity driven by low rates has had a significant impact. As investors have increased their risk exposures via equity investments and particularly through ETFs, the largest companies have continued to get larger.
We note an interesting graph below where we look at the MSCI World and compare it to the MSCI World Equal Weighted Index over the last 5 years. The divergence is quite striking and demonstrates the dominance a few names have had on the overall performance of the market. We expect this disparity will begin to converge in a higher rate environment and investors re-allocate some of their equity holdings to bonds or as valuation differentials begin to converge as capital is allocated more discerningly.
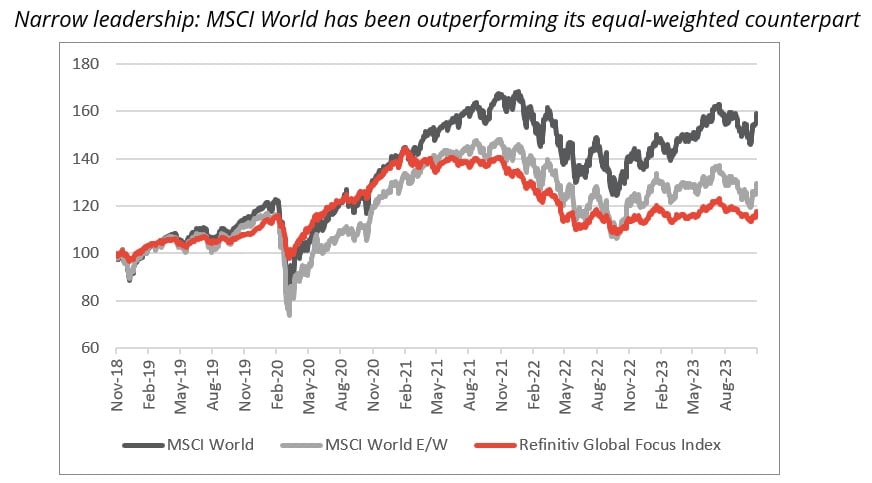
Source: Bloomberg (16 Nov 2018 to 15 Nov 2023): MSCI World, MSCI World Equal Weighted, Refinitiv Global Focus Hedged. Past performance is not a guide to future results.
It’s also interesting to note how closely convertibles have tracked an equal weighted equity index or a mid-cap index. Given our view that the equity market gap between mega cap to mid-cap will converge, we think convertibles’ performance will look attractive when compared to headline indices going forward.
A look back through periods of higher rates
While identifying historical periods similar to the current environment may be notoriously difficult, we do see parallels of the recent experience in convertible bonds with the period following the 2001/2002 equity market crash where rates remained low for a few years before beginning a steady rise in 2004 – i.e. participation in equity markets, but to a degree, which has been underwhelming.
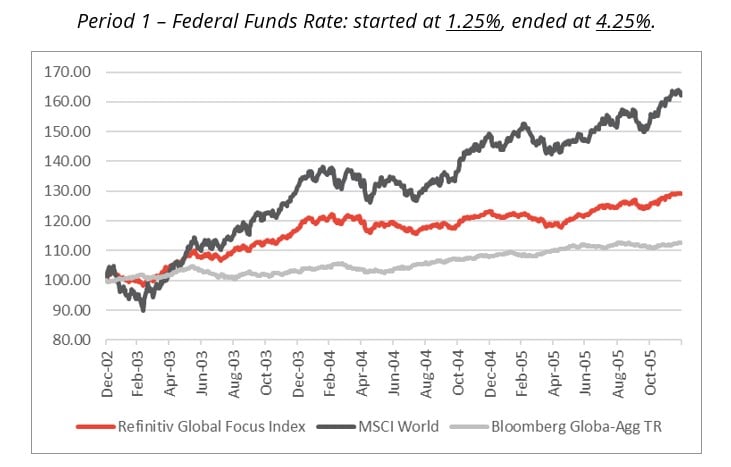
Source: Bloomberg (31 Dec 2002 to 30 Dec 2005): Refinitiv Global Focus Hedged, MSCI World, Bloomberg Global Aggregate TR Index. Past performance is not a guide to future results.
What is very interesting, however, is the performance observation of the following period where rates peak and subsequently begin declining, which we think could be a good precursor to convertible performance going forward, given the points outlined above (see chart below).
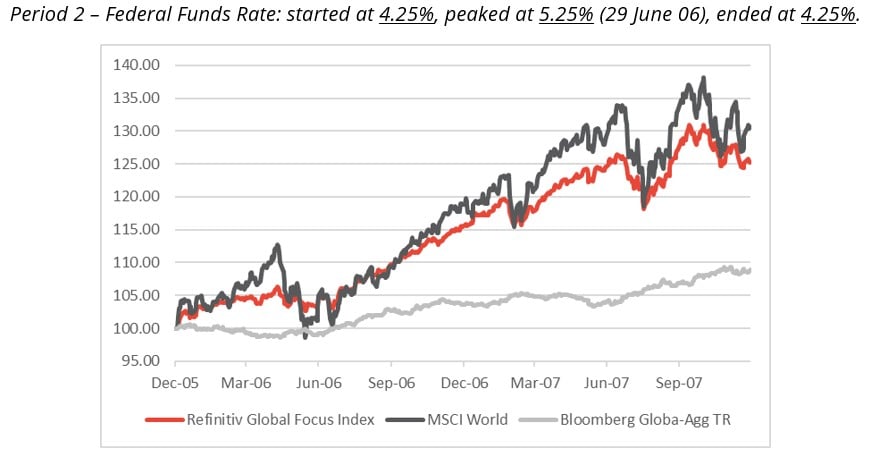
Source: Bloomberg (30 Dec 2005 to 28 Dec 2007): Refinitiv Global Focus Hedged, MSCI World, Bloomberg Global Aggregate TR Index. Past performance is not a guide to future results.
Given our belief that we are entering a period where interest rates will be higher for longer, another historical period of note is from the end of 1995 to the end of 2000. During this timeframe, where the federal funds rate remained elevated for 5 years, convertibles benefited from strong equity participation and exhibited strong overall returns.
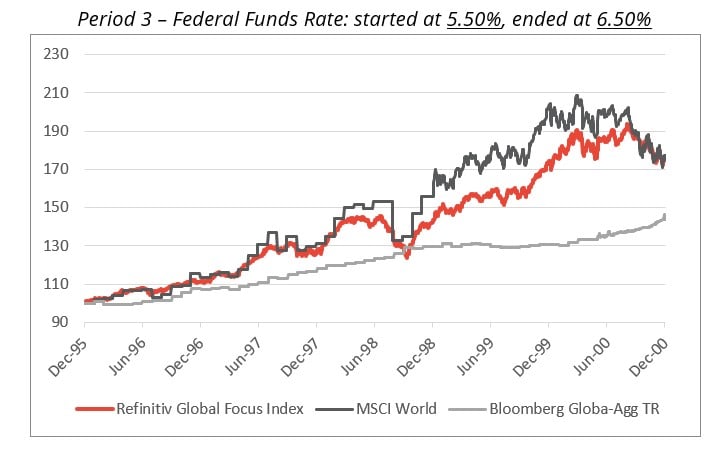
Source: Bloomberg (29 Dec 1995 to 29 Dec 2000): Refinitiv Global Focus Hedged, MSCI World, Bloomberg Global Aggregate TR Index. Note: MSCI World pricing is only available on a daily basis in Bloomberg from 31 Dec 1998. Past performance is not a guide to future results.
It’s not just about higher rates
Valuations remain very attractive as convertibles are trading inexpensive to fair value, with many balanced convertibles currently trading at a discount, which can be a useful tailwind for future returns. This also places bond profiles much closer to their floors, which, when combined with higher levels of income, increases the asymmetry of returns for balanced funds.
The strength of bond floor(s) is a particular focus of our product with a greater Investment Grade focus. While this has not necessarily proven beneficial as High Yield has performed very well, we think that the higher rate environment may make it challenging for the more indebted companies to raise capital and hence the shorter nature, higher credit quality of our approach may prove beneficial going forward. Thematically, convertibles retain a good exposure to mid-cap technology companies and could be a large beneficiary of the Artificial Intelligence (AI) wave permeating across various industries.
Conclusions
We expect the investment landscape in the next 10 years to look substantially different from the preceding 10, and while this could arguably be said at any point in time, we feel the differences are much more evident currently. The paradigm shift in interest rates will have profound implications going forward from major asset allocation shifts to more diligent allocation of capital, bringing with it volatility and uncertainty.
The technological breakthroughs we are witnessing in the field of AI will also present a substantially altered investment landscape and convertibles may offer a tool to investors to both mitigate risks but also participate in this exciting and life-changing theme.
Key Information
No investment strategy or risk management technique can guarantee returns or eliminate risks in any market environment. Past performance is not a guide to future results. The prices of investments and income from them may fall as well as rise and an investor’s investment is subject to potential loss, in whole or in part. Forecasts and estimates are based upon subjective assumptions about circumstances and events that may not yet have taken place and may never do so. The statements and opinions expressed in this article are those of the author as of the date of publication, and do not necessarily represent the view of Redwheel. This article does not constitute investment advice and the information shown is for illustrative purposes only.

