You know that you are a bit of an investment geek when you get as excited about the release of the annual Credit Suisse Investment Returns Handbook as others get about the new season of Love Island but nonetheless, it is something I always read and always find illuminating. Now in its fifteenth year, it is a a long-standing collaboration with Professor Paul Marsh and Dr. Mike Staunton of London Business School and Professor Elroy Dimson of Cambridge University and has established itself as one of the the definitive sources for the analysis of the long-term performance of global financial assets.
My favourite section is that on Style Investing which is a very long-term study of what works in investing and each year builds on the same three conclusions about which factors produce excess returns: size, value and momentum.[1]
1. Size
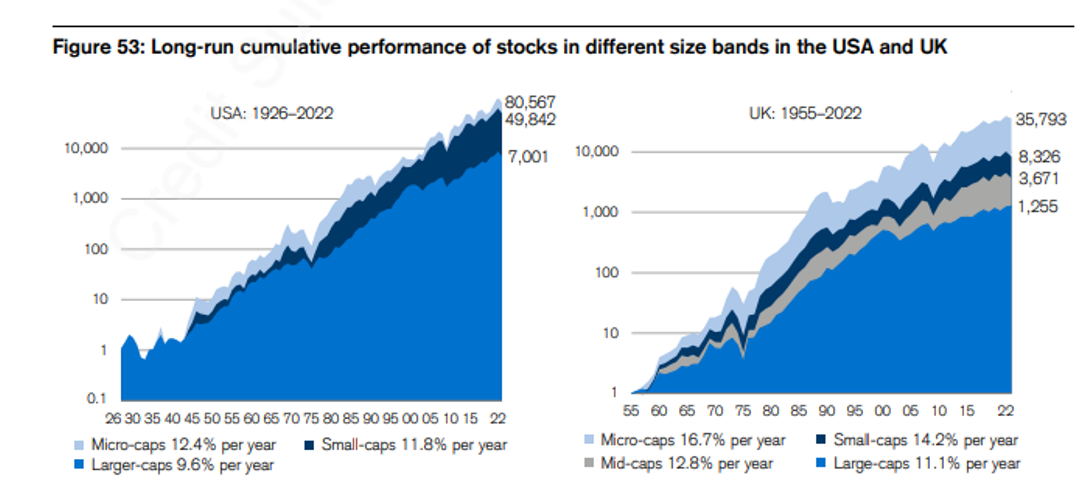
The study shows that in the US stock market between the period 1926 and 2022, the returns on large-cap stocks were an annualised 9.6%, while small and microcap stocks achieved 11.8% and 12.4%, respectively. This meant that a dollar invested in 1926 in larger companies, with dividends reinvested, grew in value to $7,001, a similar investment in small caps gave a terminal value seven times greater at $49,842. Micro-cap stocks did best of all, with an end-2022 value of $80,567.

Source: © Elroy Dimson, Paul Marsh and Mike Staunton; US CRSP capitalization decile returns are from Morningstar. UK Size-based returns are from Evans and Marsh (2023) and are for the Numis Smaller Companies Indexes ex investment companies. Past performance is not a guide to future returns. The information shown above is for illustrative purposes.
The evidence from the UK, although covering a shorter period from 1955 to the present date, reaches a similar conclusion. The chart shows that £1 invested in UK large caps at the start of 1955, with dividends reinvested, would have grown to £1,255 by end-2022, giving an annualised return of 11.1%. The same sum of money invested in the Numis Mid Cap index would have generated £3,671, while the Numis Small Cap Index would have generated £8,326, 6.6 times as much as large caps. However, an investment in micro-caps would have yielded £35,793, over four times as much as from the NSCI, and equivalent to an annualised return of 16.7%.
2. Value (price to book)
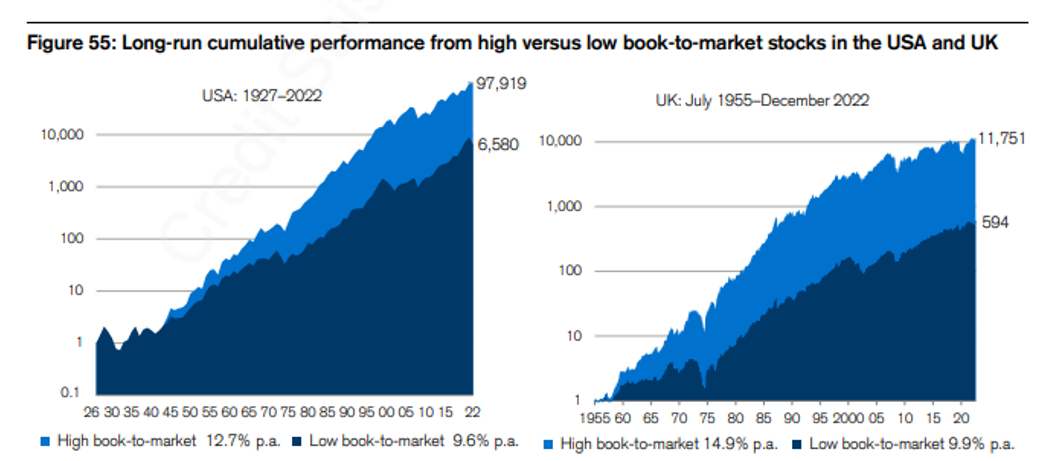
As a value investor, one of the findings I am most encouraged by is that value investing earns a significant premium in the long run. As the charts below show, in the US, $1 invested in the cheapest part of the market in 1926 was worth $97,919 by the end of 2022 whilst $1 invested in the most expensive part of the market was only worth $6,580.

Source: © Elroy Dimson, Paul Marsh and Mike Staunton; US data is from Professor Kenneth French, Tuck School of Business, Dartmouth (website). UK data is from Dimson, Nagel and Quigley, 2003, updated by Elroy Dimson, Paul Marsh and Mike Staunton using the London Share Price Database. Past performance is not a guide to future returns. The information shown above is for illustrative purposes.
Value (High Dividend Yield)
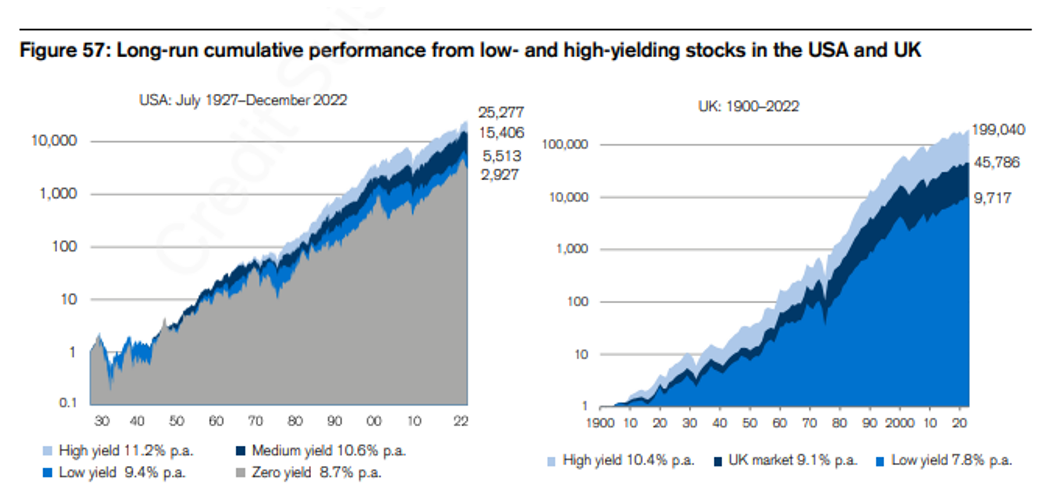
As well as looking at returns using price to book, the authors also use dividend yield as a measure of valuation and derive similar, although less extreme, results with the highest yielding part of the market generating 11.2%p.a. in the US versus 9.4% for the lowest yielding part meaning that $1 becomes $25,277 in the former and only $5,513 in the latter over the period 1927 to 2022. The data for the UK market actually starts from 1900 and the power of compounding means that the results are simply staggering with £1 producing £199,040 in high yielding stocks versus £9,717 in low yielding stocks.

Source: © Elroy Dimson, Paul Marsh and Mike Staunton; US data is from Professor Kenneth French, Tuck School of Business, Dartmouth (website). UK data is from Elroy Dimson, Paul Marsh, and Mike Staunton, London Share Price Database. Past performance is not a guide to future returns. The information shown above is for illustrative purposes.
3. Momentum
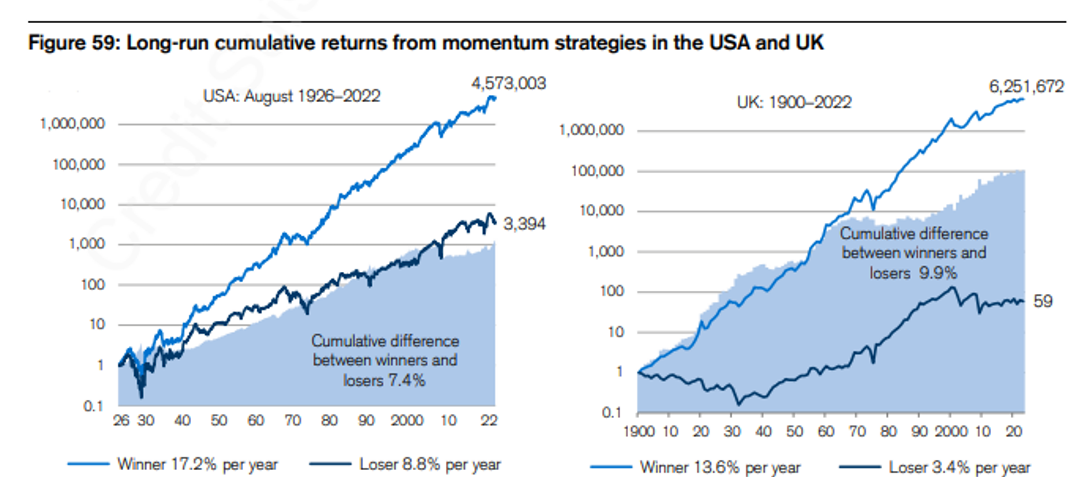
One of the factors that surprises me the most is momentum. The idea that every year you could systematically rank last year’s winners, buy them and then be rewarded with an excess return feels like it is so simplistic that it should ultimately be competed away and yet it appears to be enduring. Of all the factors identified, this actually appears to be the one that generates the greatest alpha having generated returns of 17.2% p.a between 1926 and 2022 in the US market and therefore turning $1 in to $4.5m. Even Fama and French have described momentum as the ‘premier anomaly’.

Source: © Elroy Dimson, Paul Marsh and Mike Staunton; US data is from Griffin, Ji and Martin (2003) to end-2000 updated to end -2022 by Elroy Dimson, Paul Marsh and Mike Staunton based on a 6/1/6 strategy; UK data is from Elroy Dimson, Paul Marsh, and Mike Staunton for a 12/1/1 strategy for the Top 100 UK stocks, using the London Share Price Database,Past performance is not a guide to future returns. The information shown above is for illustrative purposes.
Our Conclusions
The research discussed above suggests that there are some factors which produce excess returns and others which produce returns below that of buying a simple index fund. We believe if investors were rational, one might reasonably expect to find the equity portion of portfolios tilted towards those factors which have been shown to produce an excess return (small cap, value and momentum) even if risk management would suggest not being exclusively focused on them. My own experience is that this isn’t generally the case and that it is currently much more common to find investors with a sizeable allocation to large cap and growth (the factors that are shown in the charts above to produce returns less than the market) than small cap and value. Even after these factors produced disappointing returns in 2022, investors seem to have doubled down on them and assets continued to pour into growth firms such as ARK Invest last year. So, what explains this seemingly irrational behaviour?
1. One has to acknowledge that the problem with very long-term data, such as this, is that the devil is in the detail i.e. it doesn’t reveal the concentration risk (is the cheapest part of the market all in one sector?) nor the volatility of returns (small caps in the US performed poorly during The Great Depression and did not catch up with large caps until the early 1940’s and the 1990’s was also a fallow period for small cap stocks).
2. Some of these strategies may also be easier to implement in theory than in practice (for instance a large investment firm would face constraints in implementing a theoretical momentum strategy that was made up of equally weighted small cap stocks).
3. Another explanation is that it is the result of several behavioural traits which influence investors behaviours:
• Recency bias – this is the tendency amongst investors to place a higher weight on more recent data and experience even though a much longer series of data is likely to be more statistically significant. In a paper by Simonsohn et al [2] the authors showed through a series of experiments that direct experience is frequently more heavily weighted than general experience even where the latter is more objective because ‘directly experienced information triggers emotional reactions which vicarious information doesn’t’. As much as we might highlight the fact that value has beaten growth in every decade for the last 110 years bar two (the 1920’s and 2010’s) the lived experience of most of today’s investors is 2010’s and watching the FAANG stocks soar to the skies. Dry academic data has much less impact than the memory of being hauled in front of a board of trustees to explain why their fund is ten percentage points behind the index because of an underweight to growth stocks and it is the latter which is therefore more likely to influence future behaviour.
• Group think or herding – there is evidence from neuroscience to suggest that real pain and social pain are felt in the same parts of the brain thus investors are hard wired to herd.[3] If other investors are all chasing high flying growth stocks, it is emotionally extremely difficult not to do the same particularly when those investments are doing well. There is also a self-preservation element to this; missing out on a growth bubble is likely to lead firstly to a loss of assets and finally to a loss of one’s job. There is therefore sometimes a career incentive to follow the same strategies as your peers, safe in the knowledge that if it pops, you can use the excuse that ‘everyone was doing it and hence no-one could have foreseen the end’.
• The two most common biases are over optimism and over-confidence. For instance, when teachers ask a class who will finish in the top half, on average around 80% of the class think they will. But not only are people generally overly optimistic but they are sometimes over-confident as well and people are surprised more often than they expect to be. When asked to give a forecast and provide estimates of 98% confidence interval, the true answer only lies within the limits around 60-70% of the time. In investment terms, these traits lead many investors to mistakenly believe they can spot ‘next Amazon’ in the face of overwhelming evidence that very few companies can grow at an above average rate on a sustainable basis and that few investors are able to spot them ex ante. Another form of over confidence is in macro forecasting. When explaining a big overweight to growth stocks, a common explanation is that the investors ‘know’ that the Fed is about to pivot and that this will be good for technology stocks. The reason why they have this informational advantage over all other investors is usually less clear.
It never ceases to amaze me how difficult many people make investing. Using strategies that employ factors which have historically been shown to be successful is a way of tilting the odds of success in your favour. Betting on factors that have a long history of producing poor returns but have worked recently is like watching someone drive 300 yards from the tee with a putter and then deciding to copy those tactics for the next eighteen holes – not a strategy likely to be successful in the long run.
We would like to thank Professors Dimson and Marsh and Dr. Staunton for allowing us to reproduce the charts from their study here.
Sources:
[1] The study also finds a low volatility anomaly although the data for this typically coincides with the forty year period in which inflation and interest rates declined and this may have had a positive influence on bond proxy type stocks. We would want to see this factor work in an entirely different environment before concluding that it was a sustainable source of alpha.
[2] ‘The Tree of Experience in the Forest of Information’ by Simonsohn, Karlsson, Loewenstein and Ariely (2004)
[3] ‘Why Rejection Hurts: a Common Neural Alarm System for Physical and Social Pain’ by Eisenberger and Lieberman (2004)
Key Information
No investment strategy or risk management technique can guarantee returns or eliminate risks in any market environment. Past performance is not a guide to future results. The prices of investments and income from them may fall as well as rise and an investor’s investment is subject to potential loss, in whole or in part. Forecasts and estimates are based upon subjective assumptions about circumstances and events that may not yet have taken place and may never do so. The statements and opinions expressed in this article are those of the author as of the date of publication, and do not necessarily represent the view of Redwheel. This article does not constitute investment advice and the information shown is for illustrative purposes only.


