We have always tried to support our contention that value investing produces an above market return (and conversely that growth investing produces a below market return) with empirical evidence but some of the most often cited studies are now quite dated.
In December 1994, Josef Lakonishok, Andrei Shleifer and Robert Vishny (LSV) published a paper entitled ‘Contrarian Investment, Extrapolation and Risk’ which sought to explain why value strategies outperform the market. They concluded that ‘a likely reason that these value strategies have worked so well relative to the glamour strategies [1] is the fact that the actual future growth rates of earnings, cash flow, etc of glamour stocks relative to value stocks turned out to be much lower than they were in the past, or as the multiples on those stocks indicate the market expected them to be. That is, market participants appear to have consistently overestimated future growth rates of glamour stocks relative to value stocks’ [2]
In May 2001, Josef Lakonishok, this time with Louis Chan and Jason Karceski, followed his earlier work by publishing a paper entitled ‘The Level and Persistence of Growth Rates’ [3] which went a step further in trying to explain the differential in returns between glamour and value stocks by testing whether company growth rates persist and whether they were forecastable. They concluded ‘there is scant persistence in growth beyond chance, and a limited ability to identify firms with high future long-term growth’. The result for all US stocks on the Compustat database is shown in the chart below which identifies the percentage of firms that can grow at an above average rate (year 1 is obviously 50%) and then shows what percentage of firms can maintain this above average rate for all cumulative years out to a ten-year period. The stark conclusion is that growth rates mean revert very rapidly.
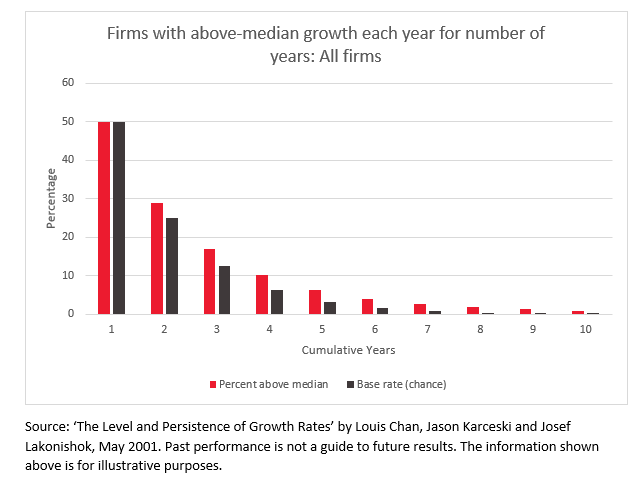
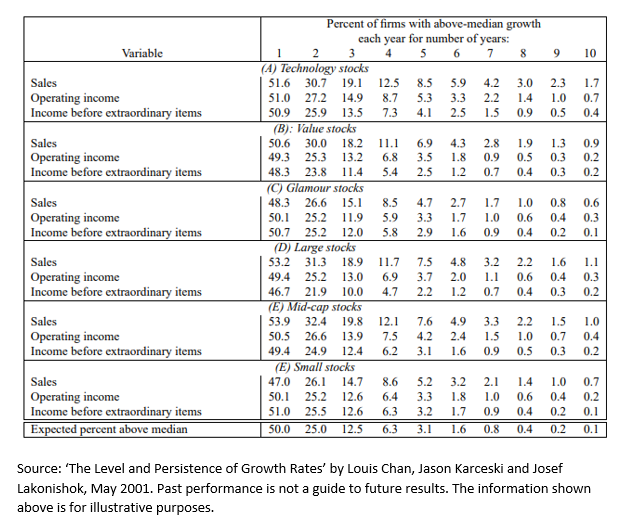
To test whether it was possible to identify the small subset of firms that were able to grow at above average rates ex-ante, they repeated the experiment using subsets including stocks with superior historic growth rates, stocks with high valuations, technology stocks and small stocks. In all cases, the fade in growth rates was not materially different from the fade rate in all firms suggesting that it was not possible to identify, in advance, stocks with the ability to grow at above average rate.
This point is key to understanding why glamour (or growth) stocks produce returns below the market average. Some investors exhibit behavioural biases such as over-confidence and recency bias that cause them to extrapolate trends and they pay high prices for companies with the highest historical growth rates and low prices for those that have lowest historical growth rates (see chart below).
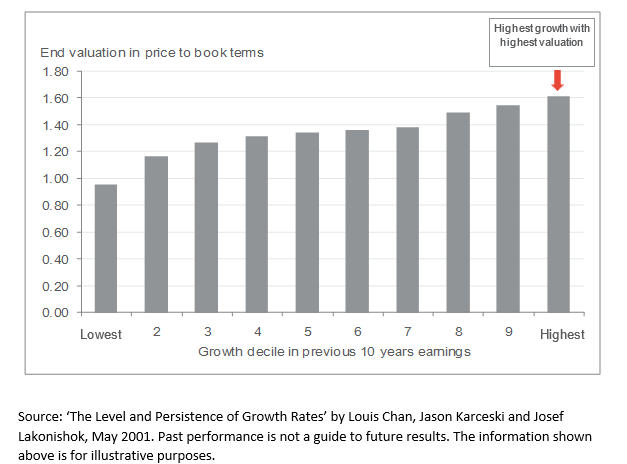
As the table above shows, it is incorrect to assume that firms with a high historical growth rate will show any persistence in the future. These firms therefore sometimes produce poor returns because as their growth rate slows, they fail to meet high expectations and de-rate. The combination of these factors depresses their total returns.
LSV attribute the outperformance to the failure of investors to formulate their predictions of the future without a “full appreciation of mean reversion.” That is, individuals tend to base their expectations on past data for the individual case they are considering without properly weighting data on what psychologists call the “base rate,” or the class average. Kahneman and Tversky (1982, p. 417 ) explain:
‘One of the basic principles of statistical prediction, which is also one of the least intuitive, is that extremeness of predictions must be moderated by considerations of predictability… Predictions are allowed to match impressions only in the case of perfect predictability. In intermediate situations, which are of course the most common, the prediction should be regressive; that is, it should fall between the class average and the value that best represents one’s impression of the case at hand. The lower the predictability the closer the prediction should be to the class average. Intuitive predictions are typically non-regressive: people often make extreme prediction on the basis of information whose reliability and predictive validity are known to be low.’ [4]
The outperformance of glamour or growth stocks in more recent years has been explained by some investors as a result of there being a new cohort of businesses which can ‘beat the fade’ because their scale and/or market position (the FAANG stocks epitomised this narrative). If true, this would invalidate the findings discussed above. We were therefore excited to see that the study by LSV was recently updated by Brian Chingono and Greg Obenshain of US based quantitative asset manager, Verdad, who examined the period 1997-2021 [5]. The authors noted that they ‘wanted to see how this finding has held up over the last 25 years, especially in light of the popular narrative of “secular changes” that have supposedly altered the economy—and the calculus of investing—in recent decades. We wanted to see if the higher valuations for growth stocks we’ve seen recently are justified by a higher level of persistence of growth rates.’
They started by noting that some investors still place high valuations on companies which have exhibited higher than average historical growth rates.
‘We can see evidence of this persistence assumption by looking at broad index data. The Vanguard US Growth Index consists of companies that have grown their earnings by 28% on average over the past five years. These growth stocks are priced at 29x their trailing net earnings, a 52% premium to the overall US market’s 19x Price/Earnings ratio. The average company in the US market portfolio has increased earnings by 20% annually over the past five years, an impressive number that seems to warrant similar discount rates between the overall market and growth stocks.’
Their findings (see tables below) were that the conclusions of LSV were still valid and that there remains little evidence of persistence in growth rates. On this basis, investors are still wrong to place higher valuations on companies with higher growth rates.
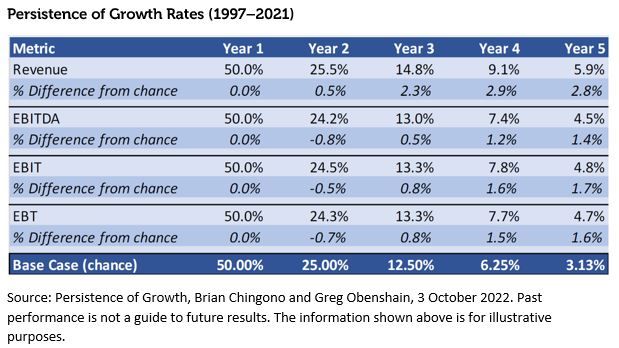
Repeating the methodology of LSV, they examined the cohort of companies which had the highest historical growth rates but again found little evidence of persistence.
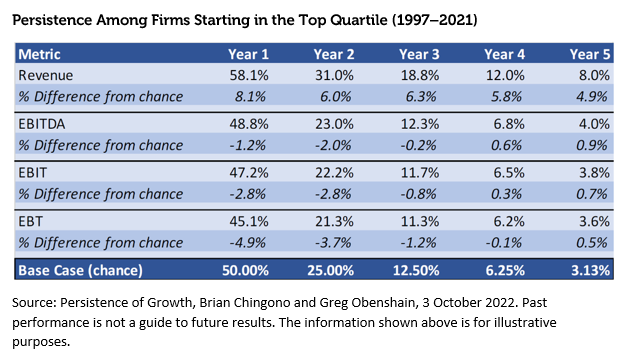
The authors conclude that ‘it seems that any secular changes in the economy over the past two decades have not changed the basic conclusion that earnings growth is not persistent beyond chance over the long term’
Conclusion
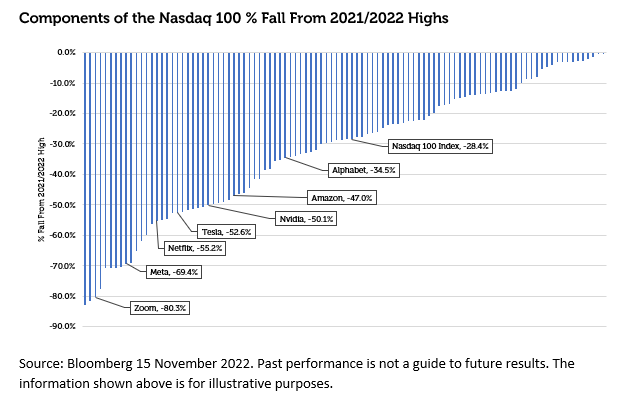
We continue to be perplexed that so many investors remain over-exposed to growth stocks given both the empirical evidence that they may produce below market returns in the long run as well the behavioural insights into why this is the case. Our assumption is that this is both a function of recency bias (growth stocks did well in recent years until 2022) combined with a very plausible narrative that a new cohort of companies existed which could beat the fade (of course a similar narrative existed during the Nifty Fifty Bubble of the Sixties and the TMT bubble of the Nineties). The evidence above suggests that this narrative is not supported by the data whilst the recent declines in share prices of growth stocks (see chart below) suggest an Emperors Clothes moment may have been reached. We continue to believe that the recent outperformance of growth was an aberration created by central bank monetary policy which is now reversing and that investors should be re-balancing towards value stocks.
Sources:
[1] Universe was divided into book-to-market deciles using COMPUSTAT data for the end of the previous fiscal year
[2] ‘Contrarian Investment, Extrapolation and Risk’ by Josef Lakonishok, Andrei Shleifer and Robert Vishny December 1994
[3] ‘The Level and Persistence of Growth Rates’ by Louis Chan, Jason Karceski and Josef Lakonishok May 2001
[4] Judgement Under Uncertainty: Heuristics and Biases by Kahneman, Slovic and Tversky 1982
[5] Persistence of Growth by Brian Chingono and Greg Obenshain, Verdad, October 2022
Key Information
No investment strategy or risk management technique can guarantee returns or eliminate risks in any market environment. Past performance is not a guide to future results. The prices of investments and income from them may fall as well as rise and an investor’s investment is subject to potential loss, in whole or in part. Forecasts and estimates are based upon subjective assumptions about circumstances and events that may not yet have taken place and may never do so. The statements and opinions expressed in this article are those of the author as of the date of publication, and do not necessarily represent the view of Redwheel. This article does not constitute investment advice and the information shown is for illustrative purposes only.


