Can gold hold its value?
Gold is acknowledged as a medium of exchange, a store of value and a unit of account. When President Nixon cancelled the convertibility of the US dollar into gold in 1971, the money supply came under the control of central banks. Since the collapse of the Bretton Woods system of financial exchange in that year, fiat currency has tended to depreciate against gold during periods of high inflation, financial stress or geopolitical uncertainty. The US dollar and other fiat currencies can show stability for quite long periods, then depreciate suddenly, which is reflected in the rising price of gold.
Below, we argue that a confluence of macroeconomic factors will continue to boost global demand for gold, supporting historically high prices. We believe that gold producers are poised to benefit.
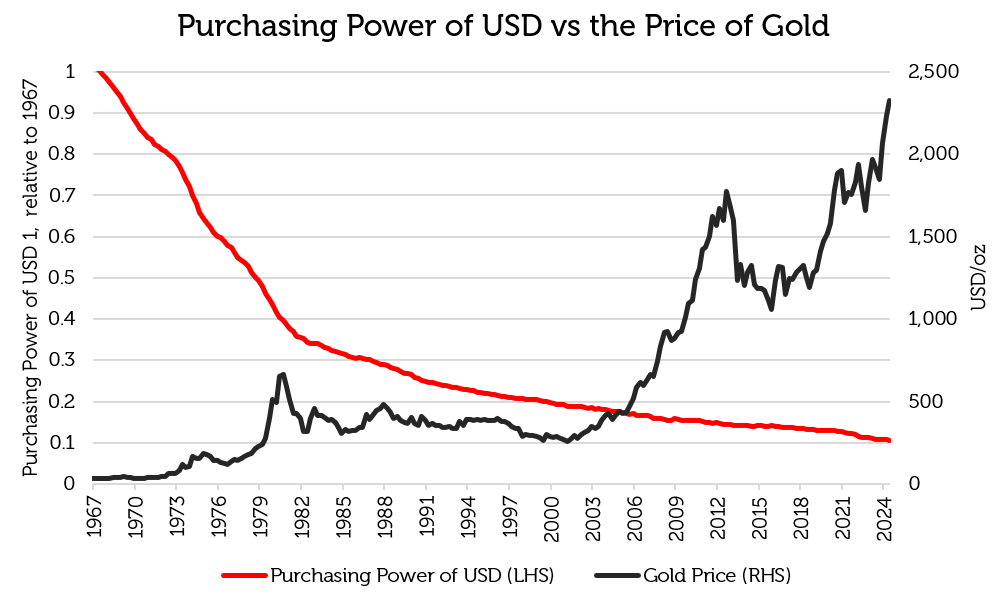
Source: US Bureau of Labor Statistics, Bloomberg as of 28 June 2024. The information shown above is for illustrative purposes. Past performance is not a guide to future results.
Inflation supports precious metals
A quarter of a century of price stability from 1981 onwards gave the impression that gold was no longer a necessary store of value, but significant price shifts in the 1970s, 2000s and over the past year have shown that gold diversifies portfolios and hedges against inflation, uncertainty and credit risk. Since the departure from the gold standard in 1971, the US dollar has depreciated against gold at a compound annual growth rate (CAGR) of 8.0% per annum, which roughly equates to the 7.8% annual price change of the S&P 500 Index over the same period [1].
Appreciation of gold price over time
| % Change | CAGR |
1972 – 1980 | 1256.4% | 33.6% |
1981 – 2006 | 0.0% | 0.0% |
2006 – 2011 | 212.8% | 20.9% |
2011 – 2023 | 2.6% | 0.3% |
2023 – 2024 | 27.4% | 27.4% |
Source: Bloomberg as of 30 June 2024. CAGR stands for compound annual growth rate. The information shown above is for illustrative purposes. Past performance is not a guide to future results. Dates reflect periods of high % change rates vs low rates.
Often overlooked is silver, dubbed the ‘poor man’s gold’ because it is cheaper than gold. However, it is affected by the same factors. Silver’s additional use as an industrial metal contributes to its greater volatility than gold, making it a less reliable store of value. Silver has gained 5.4% a year since 1971 but has yet to scale the peaks of 1980 and 2011.

Source: Bloomberg as of 30 June 2024. The information shown above is for illustrative purposes. Past performance is not a guide to future results.
Reasons for resurgence – debt, deficits and inflation
Why has gold suddenly rebounded so strongly? Inflation has been stuck above the Federal Reserve’s target rate of 2% for over three years, with core inflation being even more stubborn than headline inflation.
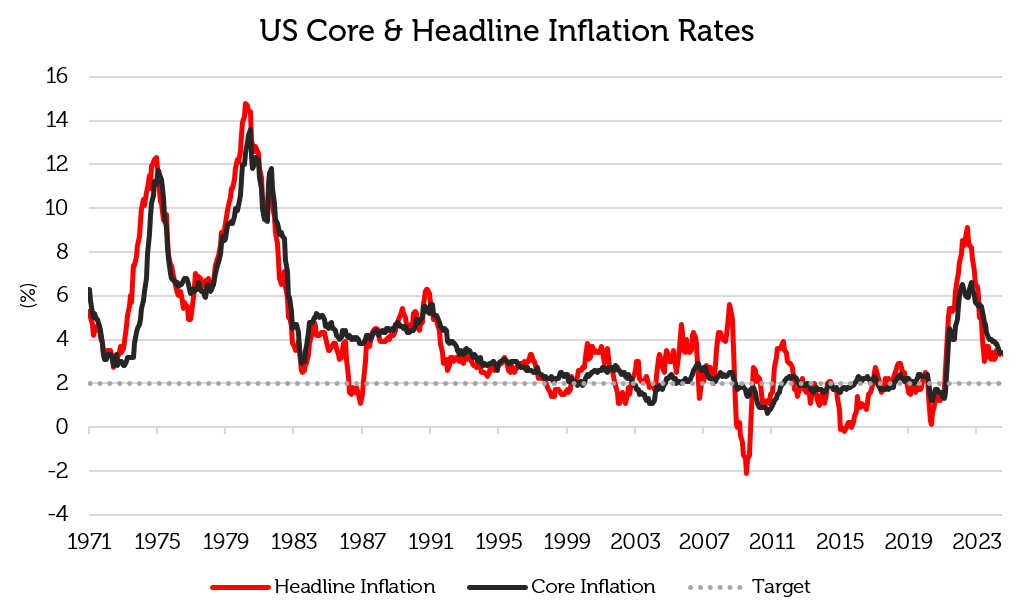
Source: Bureau of Labor Statistics, US Federal Reserve as of 30 June 2024. The information shown above is for illustrative purposes. Past performance is not a guide to future results.
This means that the Fed Funds rate is unlikely to return to the range of 0% – 2% that prevailed after the Global Financial Crisis (GFC) of 2008; Fed Funds futures indicate a terminal rate of around 4% once monetary easing gets underway later in 2024 [2]. Consequently, the 10-year US Treasury yield hovers around 5% – see the chart below – well above the average 2% – 3% range that became normal post-GFC, suggesting that although inflation might not be high, it might be persistent.
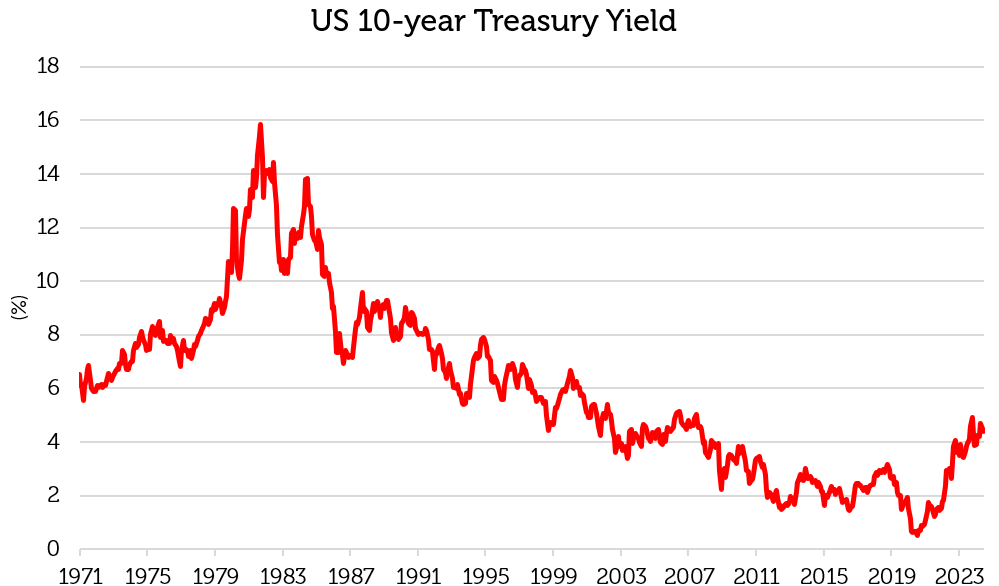
Source: Bloomberg as of 30 June 2024. The information shown above is for illustrative purposes. Past performance is not a guide to future results.
One of the possible reasons for higher inflation is the expansionary fiscal policy pursued by the American government in response to the COVID-19 crisis, which sparked increased welfare and infrastructure spending – see the chart below.
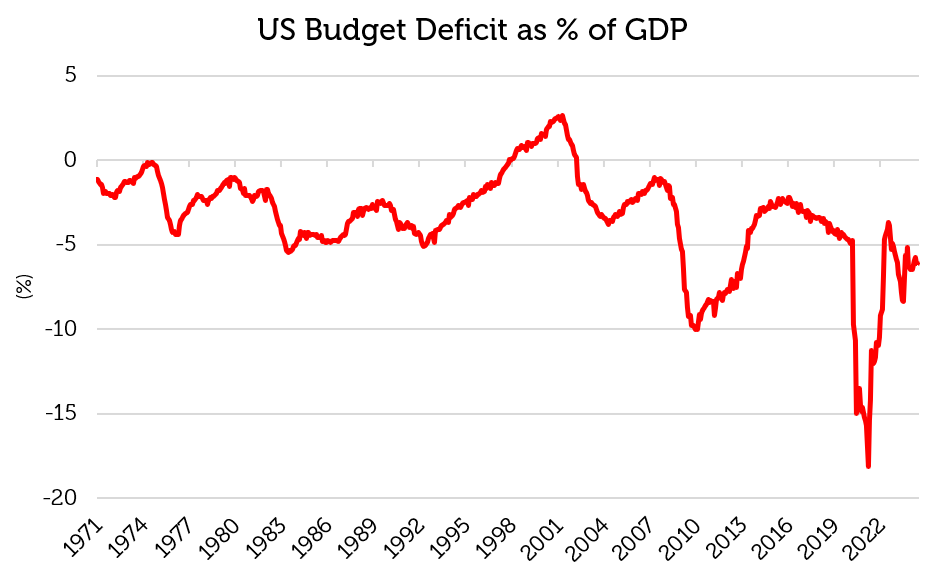
Source: Bloomberg as of 30 June 2024. The information shown above is for illustrative purposes. Past performance is not a guide to future results.
In the past half century, the US has rarely balanced its budget and the ratio of debt to GDP has climbed to its highest level since World War II – see the chart below. The financial and COVID crises of the 21st century caused federal debt roughly to double from 60% to 120% of GDP. The US government shut itself down in 2013, 2018 and from late 2018 to early 2019 and has threatened to do so again during President Biden’s term of office. The deterioration of the country’s finances, the growing debt burden and the erosion of governance prompted rating agency Fitch to downgrade the US to AA+ in August 2023. The recognition of credit risk in the US enhances the relative attractiveness of gold as an asset.
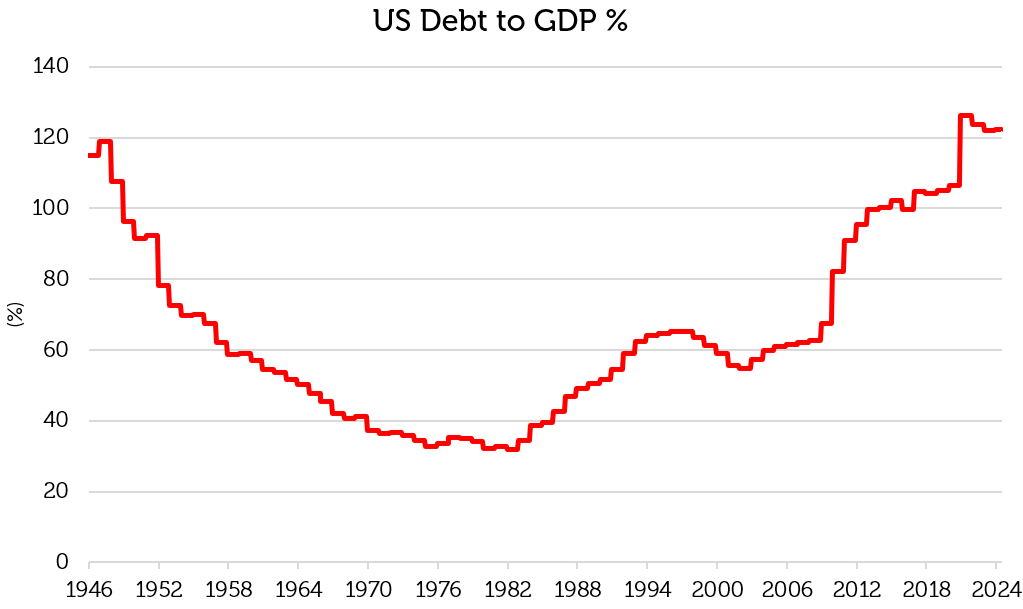
Source: Bloomberg as of 30 June 2024. The information shown above is for illustrative purposes. Past performance is not a guide to future results.
As the price of gold has risen, central banks in particular have consistently increased their purchases following of Russia’s invasion of Ukraine, seeking to diversify away from US dollar reserves – see the chart below. This is a significant source of demand for physical gold.
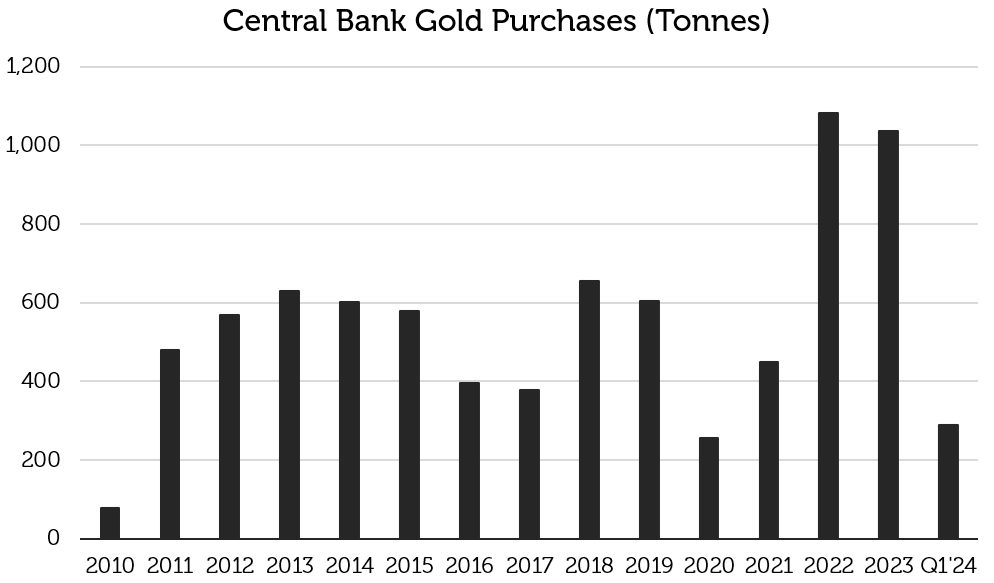
Source: World Gold Council as of 31 March 2024. The information shown above is for illustrative purposes. Past performance is not a guide to future results.
Judging by ETF holdings, financial investors have not yet found an appetite for physical gold. On the other hand, new outlets are emerging for investors looking to purchase gold. For example, United States retailers like Costco and Walmart have started to sell precious metals. It is estimated that Costco is selling up to $200mn per month [3]. In South Korea, certain convenience stores have begun to carry small weights of gold bars in their vending machines. At CU, which is South Korea’s largest convenience chain, the initial batch of 1g bars sold out in two days [4]. Demand for gold coins in South Korea increased by +27 % YoY in 1Q24 [5], and the new vending options may add additional growth. The Redwheel Emerging and Frontier Markets team anticipates that gold will trade around $2,300 per ounce in 2024, and then trade within a range of $2,300-$2,500 per ounce in 2025.
Most gold companies in the MSCI Emerging Markets Index have outperformed the index year-to-date and over the past 5 years [6]. Emerging market gold companies are mainly located in China, Latin America and South Africa. The Redwheel Emerging Markets and Next Generation Emerging Markets strategies own shares in Gold Fields, which is one of South Africa’s largest gold companies, producing c.2 million ounces a year from its mines in Australia, Ghana, Peru and South Africa [7]. The Redwheel Emerging Markets and China Equity strategies also own Zijin Mining Group, which is a diversified miner. The company recently announced their updated production guidance and expects that gold production should grow from 68 tonnes in 2023 to 100-110 tonnes in 2028 at a CAGR of 8-10% [8].
Sources:
[1] US Bureau of Labor Statistics, Bloomberg, Redwheel as of 30 June 2024
[2] Bloomberg as of 30 April 2024
[3] Costco selling up to $200 million in gold bars a month, Wells Fargo estimates (cnbc.com)
[4] Even at convenience stores, 金 tech… CU, ‘Card-type Gold’ sold out in two days – Chosun Biz
[5] World Gold Council, Gold Demand Trends 1Q24 as of 30 April 2024
[6] FactSet, Redwheel as of 30 April 2024.
[7] Gold Fields Ltd, Annual Financial Report, 2023
[8] 193802a42c3a490fb6d2fcdb25af2969.pdf (zijinmining.com)
Key Information
No investment strategy or risk management technique can guarantee returns or eliminate risks in any market environment. Past performance is not a guide to future results. The prices of investments and income from them may fall as well as rise and an investor’s investment is subject to potential loss, in whole or in part. Forecasts and estimates are based upon subjective assumptions about circumstances and events that may not yet have taken place and may never do so. The statements and opinions expressed in this article are those of the author as of the date of publication, and do not necessarily represent the view of Redwheel. This article does not constitute investment advice and the information shown is for illustrative purposes only.

