
We use strictly necessary cookies to enable our site to work and performance cookies to improve the visitor experience when visiting the site. We will only set performance cookies if you permit us to.
For more detailed information about the cookies we use, see the “Cookie Usage” section of our Privacy Policy
Convertible bonds provide a hybrid solution for investors looking for a balanced exposure to financial markets that combines the attractive elements of both equities and bonds. For more than a decade, our team has been deploying its proprietary models and systems to help identify the most attractive opportunities within the asset class. We provide a range of actively managed solutions, designed to exploit the attractive asymmetric return profile of convertible bonds with varying degrees of risk tolerance.
The Ecofin team manages a range of global equity thematic strategies with the aim of delivering strong risk-adjusted returns to clients while tackling some of the planet’s biggest environmental challenges, such as decarbonising energy supply and infrastructure.
Emerging and frontier markets represent the fastest growing economies in the world. We believe the continued growth of these markets presents compelling opportunities across a range of industries. Our index agnostic, opportunistic approach has been honed for more than two decades, and the depth of experience garnered within our team allows us to participate in attractive growth opportunities that are off the beaten track for most investors.
We invest in a small number of high-quality European companies, where we identify potentially significant opportunities to create additional value by addressing certain company-specific issues. We then act as a catalyst for change by constructively working together with the companies and other shareholders.
A highly experienced team with an established track record of delivering positive outcomes for investors. Harnessing the full power of dividends is a tried and tested method of investing, with the potential to deliver value added long-term returns and lower-than-average volatility. The team looks for the rare combination of a premium yield, sustainable dividend and attractive valuation, which only occurs when controversy appears. By working hard to understand the nature of a controversy, we aim to lean the probability of investment success in your favour.
Japan is the world’s third largest economy and its corporate landscape is undergoing dramatic change. Through our joint venture with Tokyo-based Nissay Asset Management (NAM), we invest in a small number of select Japanese companies that are not valued to their full potential due to factors we see as rectifiable. We then engage in order to act as an agent for the change required to unlock value.
Sustainability, in its broadest context, is structurally changing the investment landscape from both a risk and opportunities perspective. The Redwheel Sustainable Growth team seeks to identify structural longer-term themes and dynamics in the economy and society. The team invests capital to take advantage of the potential return opportunities these themes and dynamics offer, and to facilitate and further advance the positive impact of investee companies on critical sustainability challenges and development goals.
We are long-term value investors who believe that short-term factors prompt many market participants to overreact to news which may have little or no impact on the true value of a company. This causes share prices to diverge from the intrinsic value of the underlying business and provides an opportunity for long-term investors to purchase shares at an attractive discount. This builds in a margin of safety but also provides meaningful long-term total return potential through both dividend income and capital appreciation.

Redwheel is committed to facilitating and delivering responsible investment in practice. In line with their investment freedoms, each investment team is responsible for the integration of sustainability considerations within their respective investment processes, consistent with firm-level policies.
Redwheel’s stewardship function focuses primarily on overseeing and supporting the stewardship activities of our investment teams, co-ordinating our involvement in external stewardship initiatives, and leading in the development of the stewardship that Redwheel does as a corporate entity.
What is Sustainability Strategy, Governance & Policy? Sustainability Strategy, Governance and Policy focuses in three areas.
Greenwheel is the sustainability insights partner to Redwheel’s Sustainable, Transition and Enhanced Integration funds. Greenwheel provides tailored thematic and sector level sustainability research and advice to fund managers, commissioned by fund managers.
2025 is a rare year. It’s a perfect square (45²), the sum of cubes from 13 through 9, the first perfect square year since 1936 and the next one won’t arrive until 2116. 2025 is also a year of rare market conditions that have only been seen a few times in history.
The consensus believes the US economy is entering a new growth phase, driven by mid-cycle momentum, fiscal stimulus, and interest rate cuts – all without reigniting inflation. Moreover, US earnings will likely continue to accelerate while the rest of the world struggles under trade restrictions, a strong dollar, and weak global demand.
Exceptional conditions rarely persist indefinitely, but this broad-based conviction in prolonged US exceptionalism raises questions. Could it be different this time? How long can it last and how can contrarian investors prepare for mean reversion?
US market exceptionalism: how much further can it go?
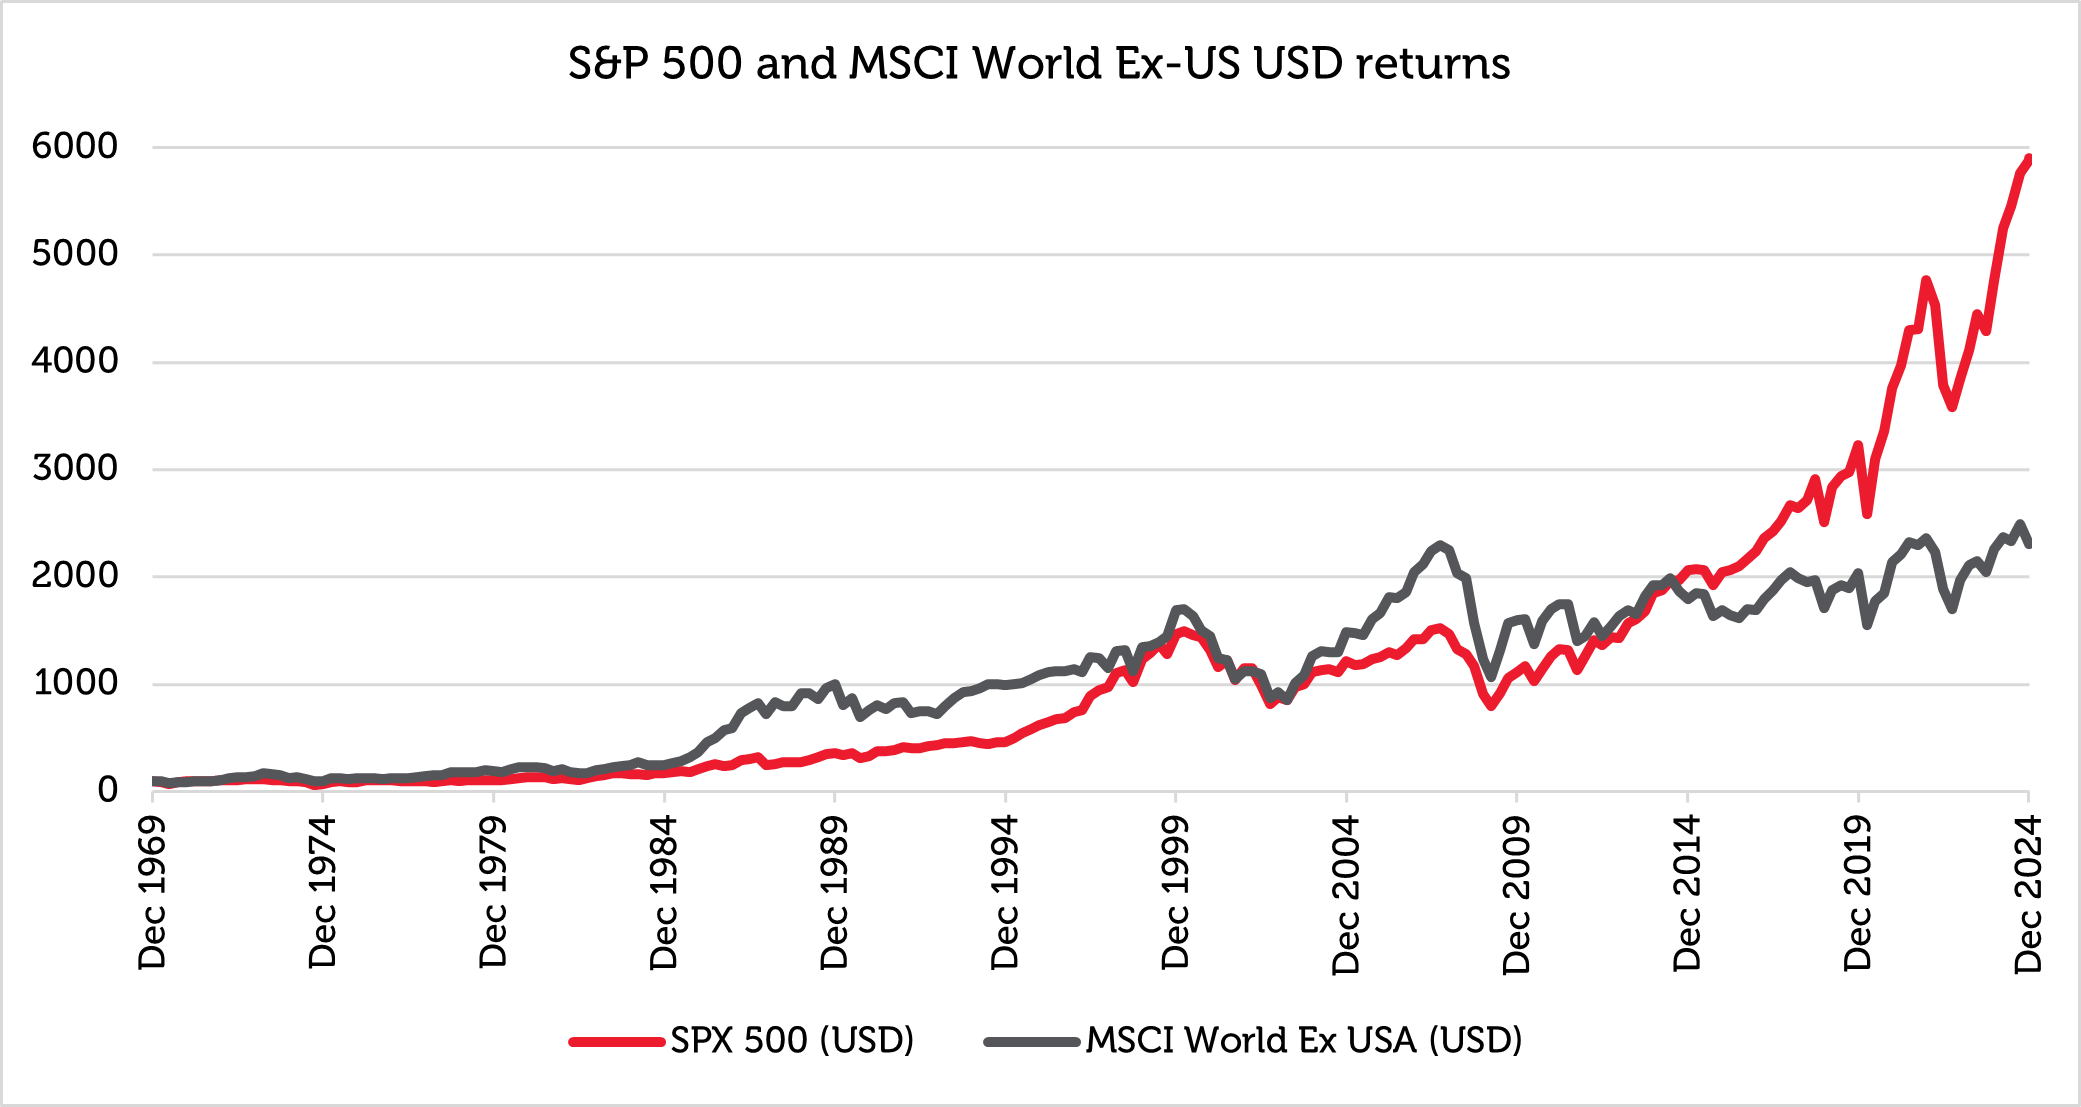
The US has already dominated global markets for more than a decade, with the S&P 500 outperforming the MSCI World (ex-US) by an extraordinary margin.
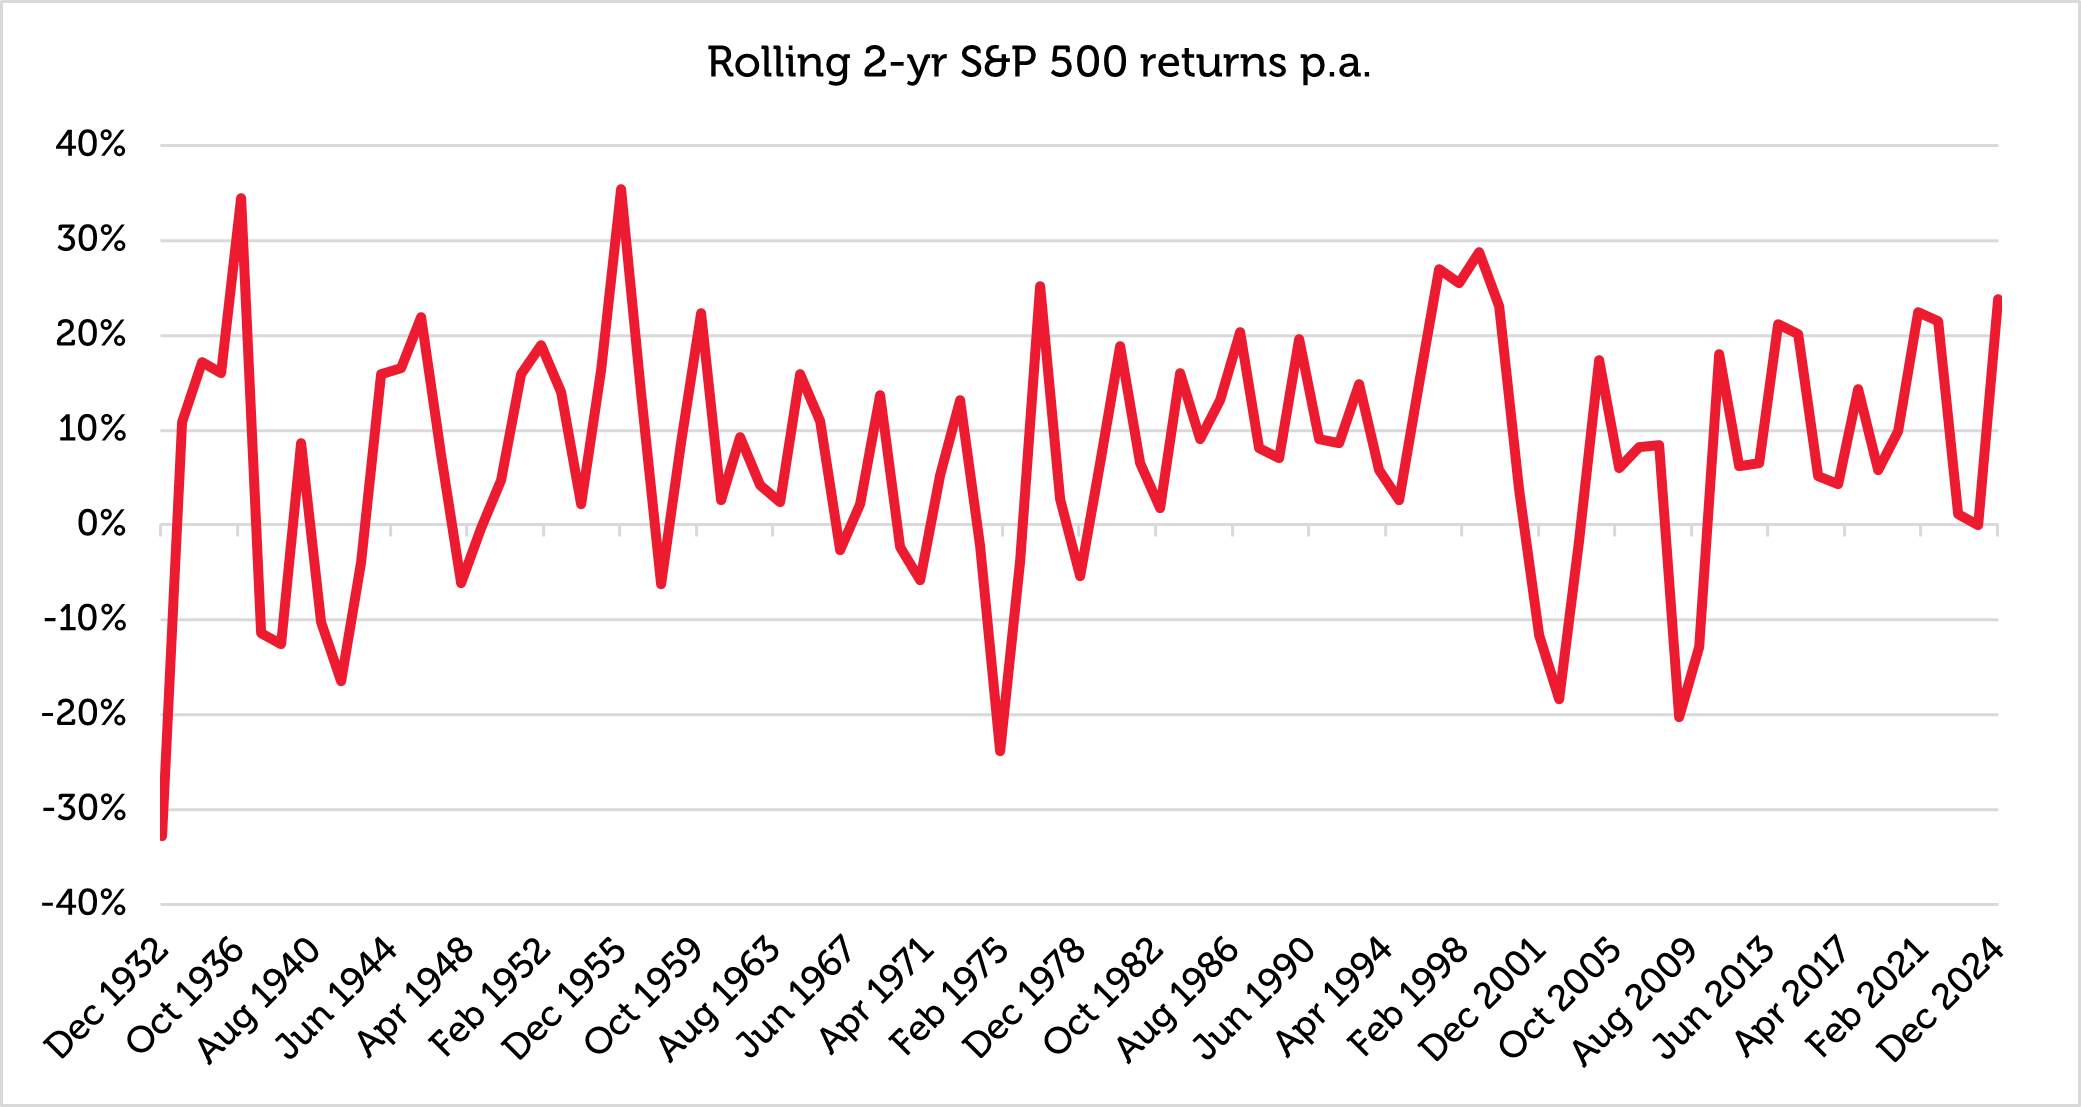
US market dominance reached new extremes in 2024, with the S&P 500 delivering its second consecutive year of 20%+ returns. This is historically rare, occurring only six times since 1929. Even rarer is for the S&P 500 to continue strongly from here. Only in 1995 did the S&P 500 go on to deliver 20%+ return years again. Once in 96 years: rare indeed.
Concentrations are also extreme. US stocks now make up over 75% of the of the MSCI World Index and the top 10 S&P 500 stocks now account for nearly 40% of total market capitalisation[1], comparable only to periods like 1929, the Nifty Fifty bubble of 1973, and the Dotcom boom of 2000.
Today, however, all of these mega-cap stocks are in Technology, specifically AI. Even at the peak of the Dotcom bubble, the market had greater sector diversification.
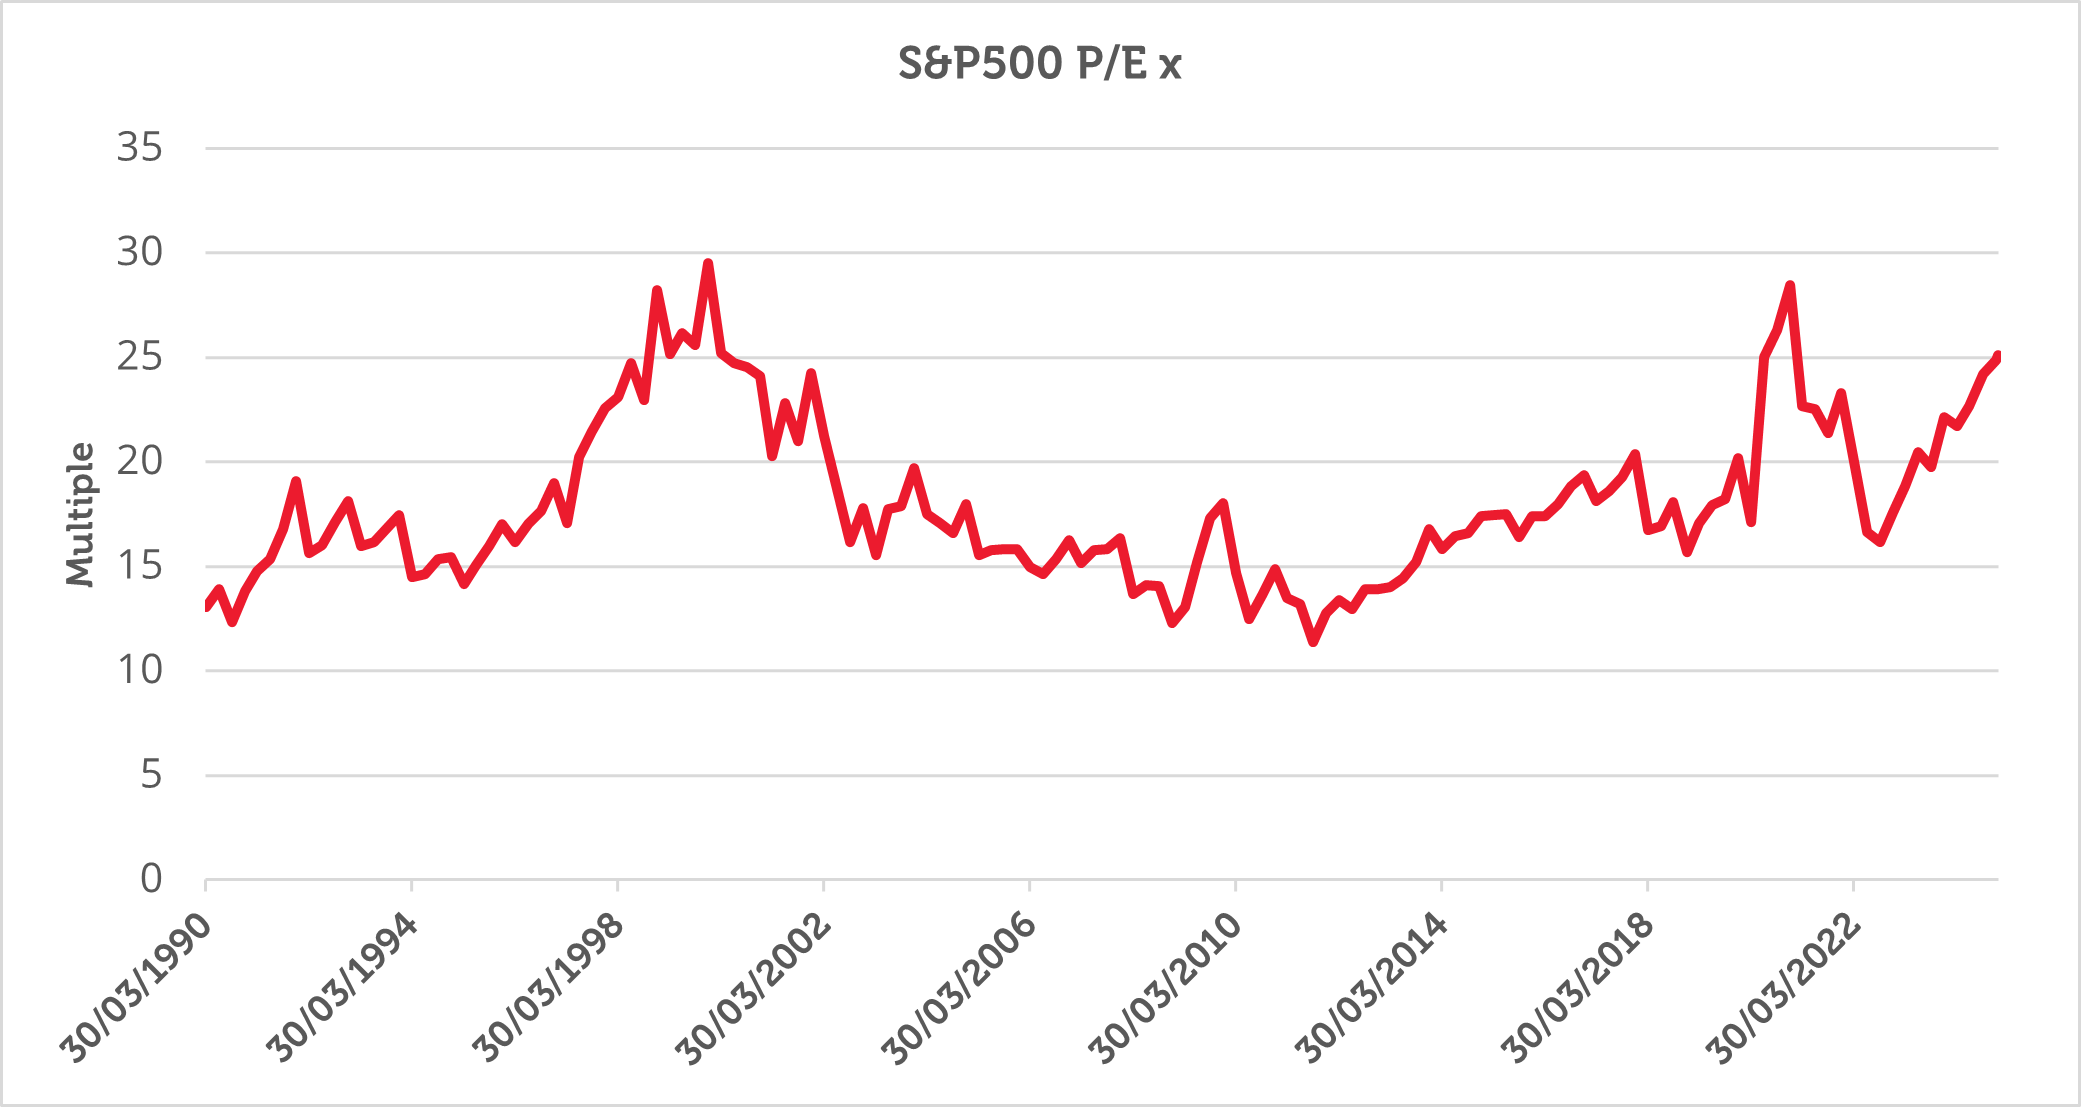
Finally, valuations are also rare. The S&P 500 ended 2024 with a P/E of 25x, a level only seen twice since 1990: the Dotcom bubble and in 2020, when pandemic-driven earnings collapsed. Sustained high valuations have historically been the exception, not the rule – but the market believes that it will be different this time.
1994–1999: A Repeat Performance?
The only time that such exuberance has persisted for any length of time was during the 1994 – 1999 period, a so-called “Goldilocks” period of high growth, low inflation, and falling interest rates.
The US equity market appears to be comparing today’s environment to this period but four crucial differences make a repeat unlikely.
1. Labour market tightness
In the early 1990s, US unemployment was above 7% before gradually falling to 4% by the end of the decade[2]. This provided slack in the labour market, allowing economic growth to accelerate without creating wage-driven inflation.
Today, unemployment is already near historic lows (4%)[3], leaving little room for further declines. To replicate the 1990s’ scenario, unemployment would need to fall to unprecedented levels.
2. Interest rate expectations vs. reality
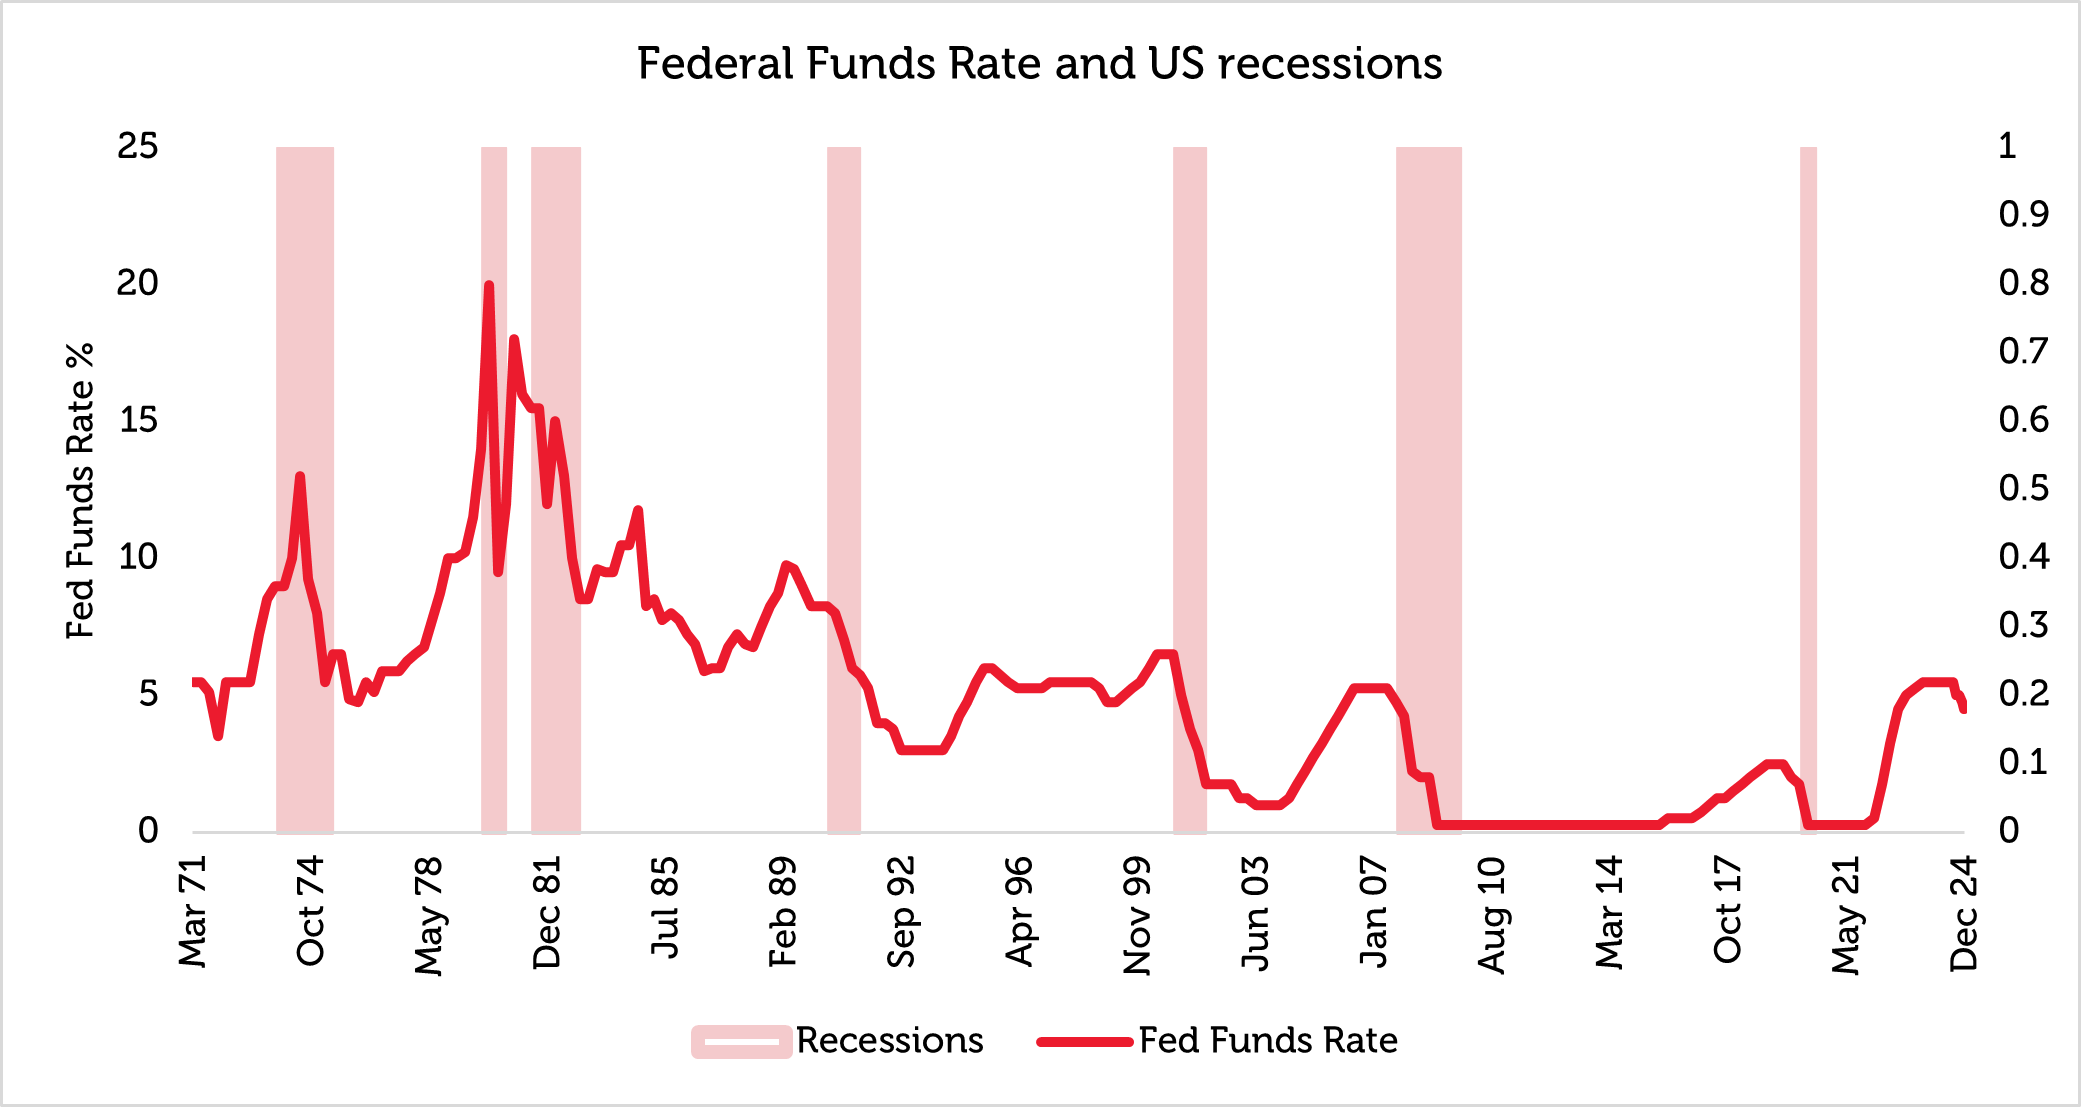
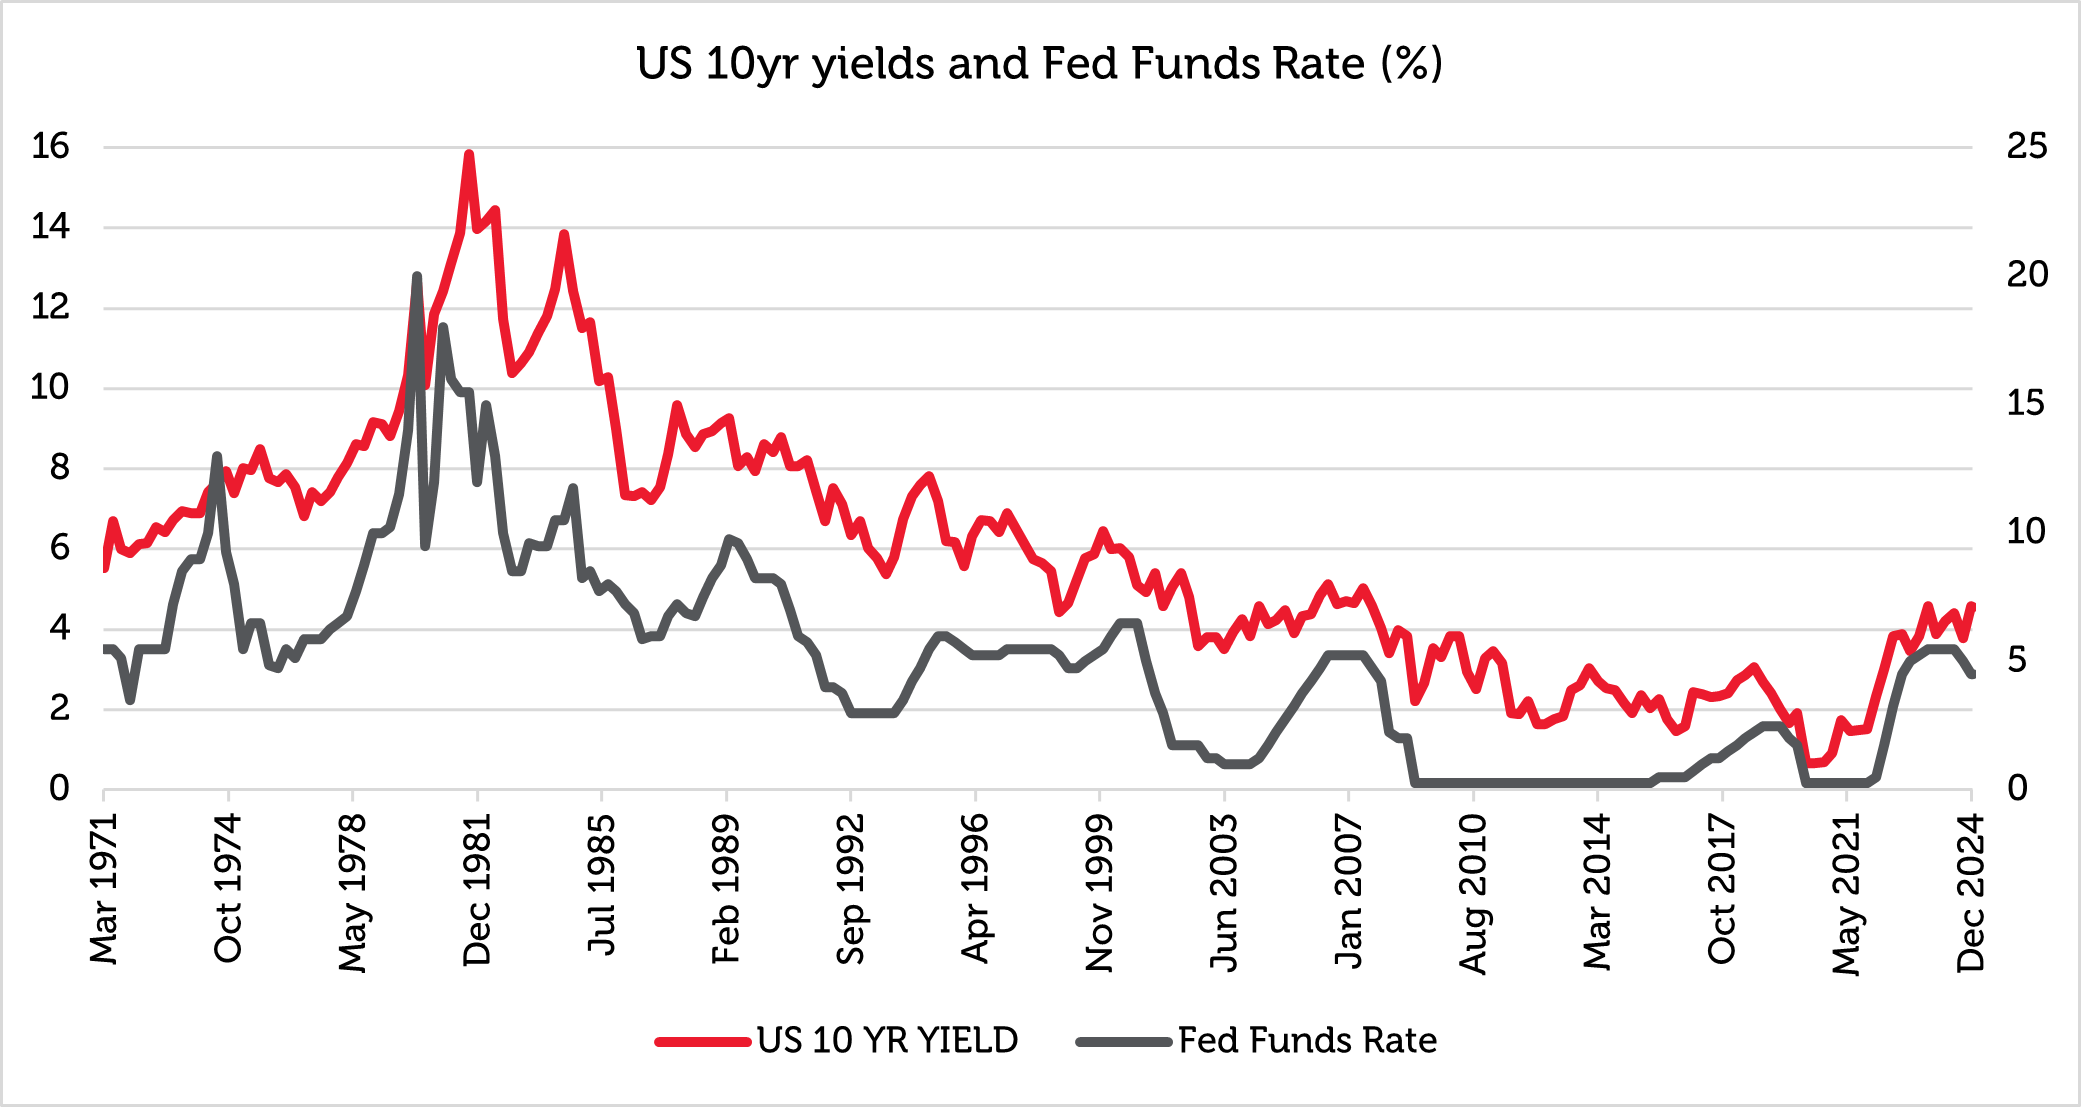
During the mid-1990s, interest rates rose from 3% to around 6% mid-decade, only falling when the Dotcom bubble burst – see the chart below.
Historically, the Federal Reserve has only cut rates meaningfully during recessions, not during expansionary periods. Given that the labour market is already near full employment, meaningful cuts would be rare indeed.
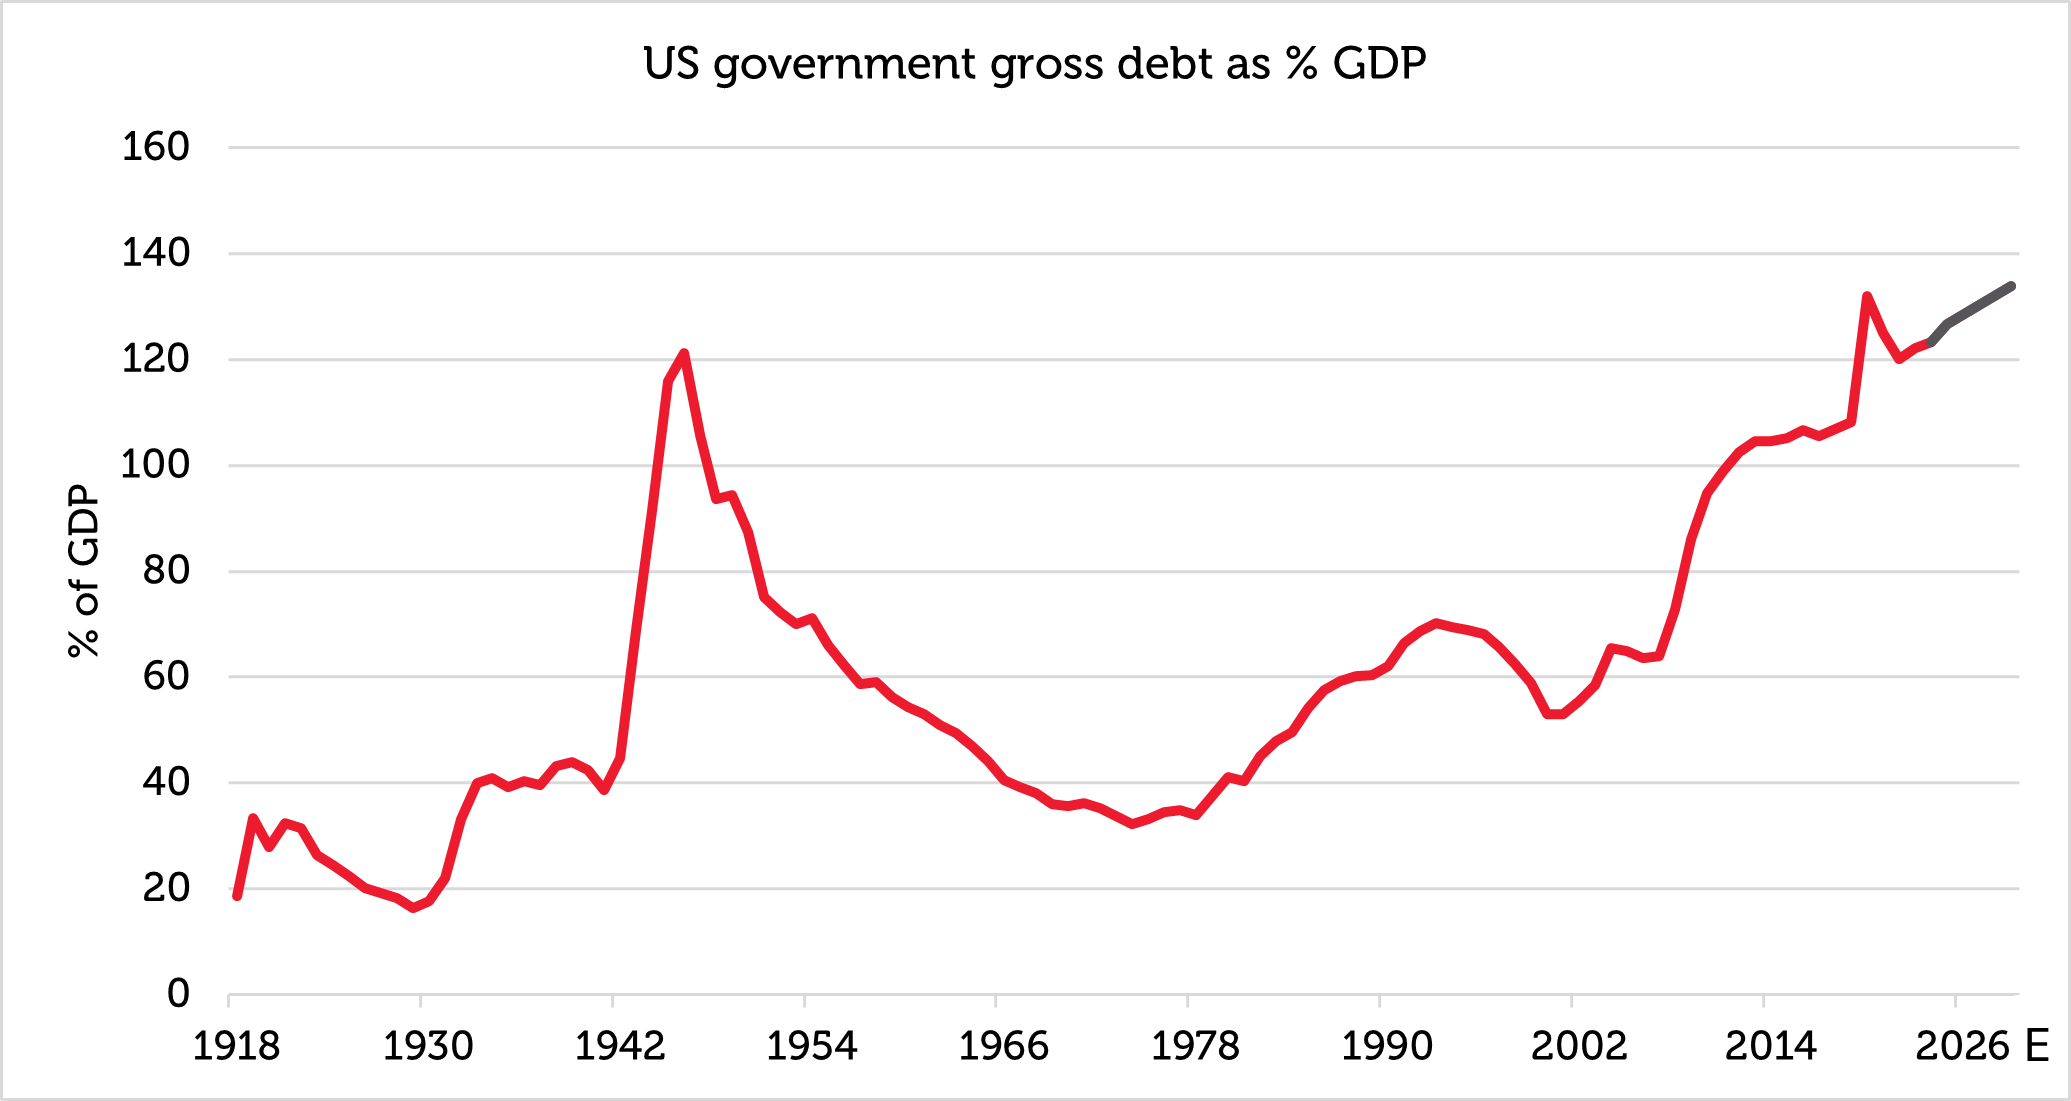
3. Debt, deficits, and fiscal constraints
One of the biggest structural differences between now and the 1990s is the fiscal backdrop.
In the mid-1990s, US government debt-to-GDP stood at 70%, leaving room for expansionary fiscal policy. Today, debt-to-GDP is 120%—a level where the US government is significantly more sensitive to interest rate movements.
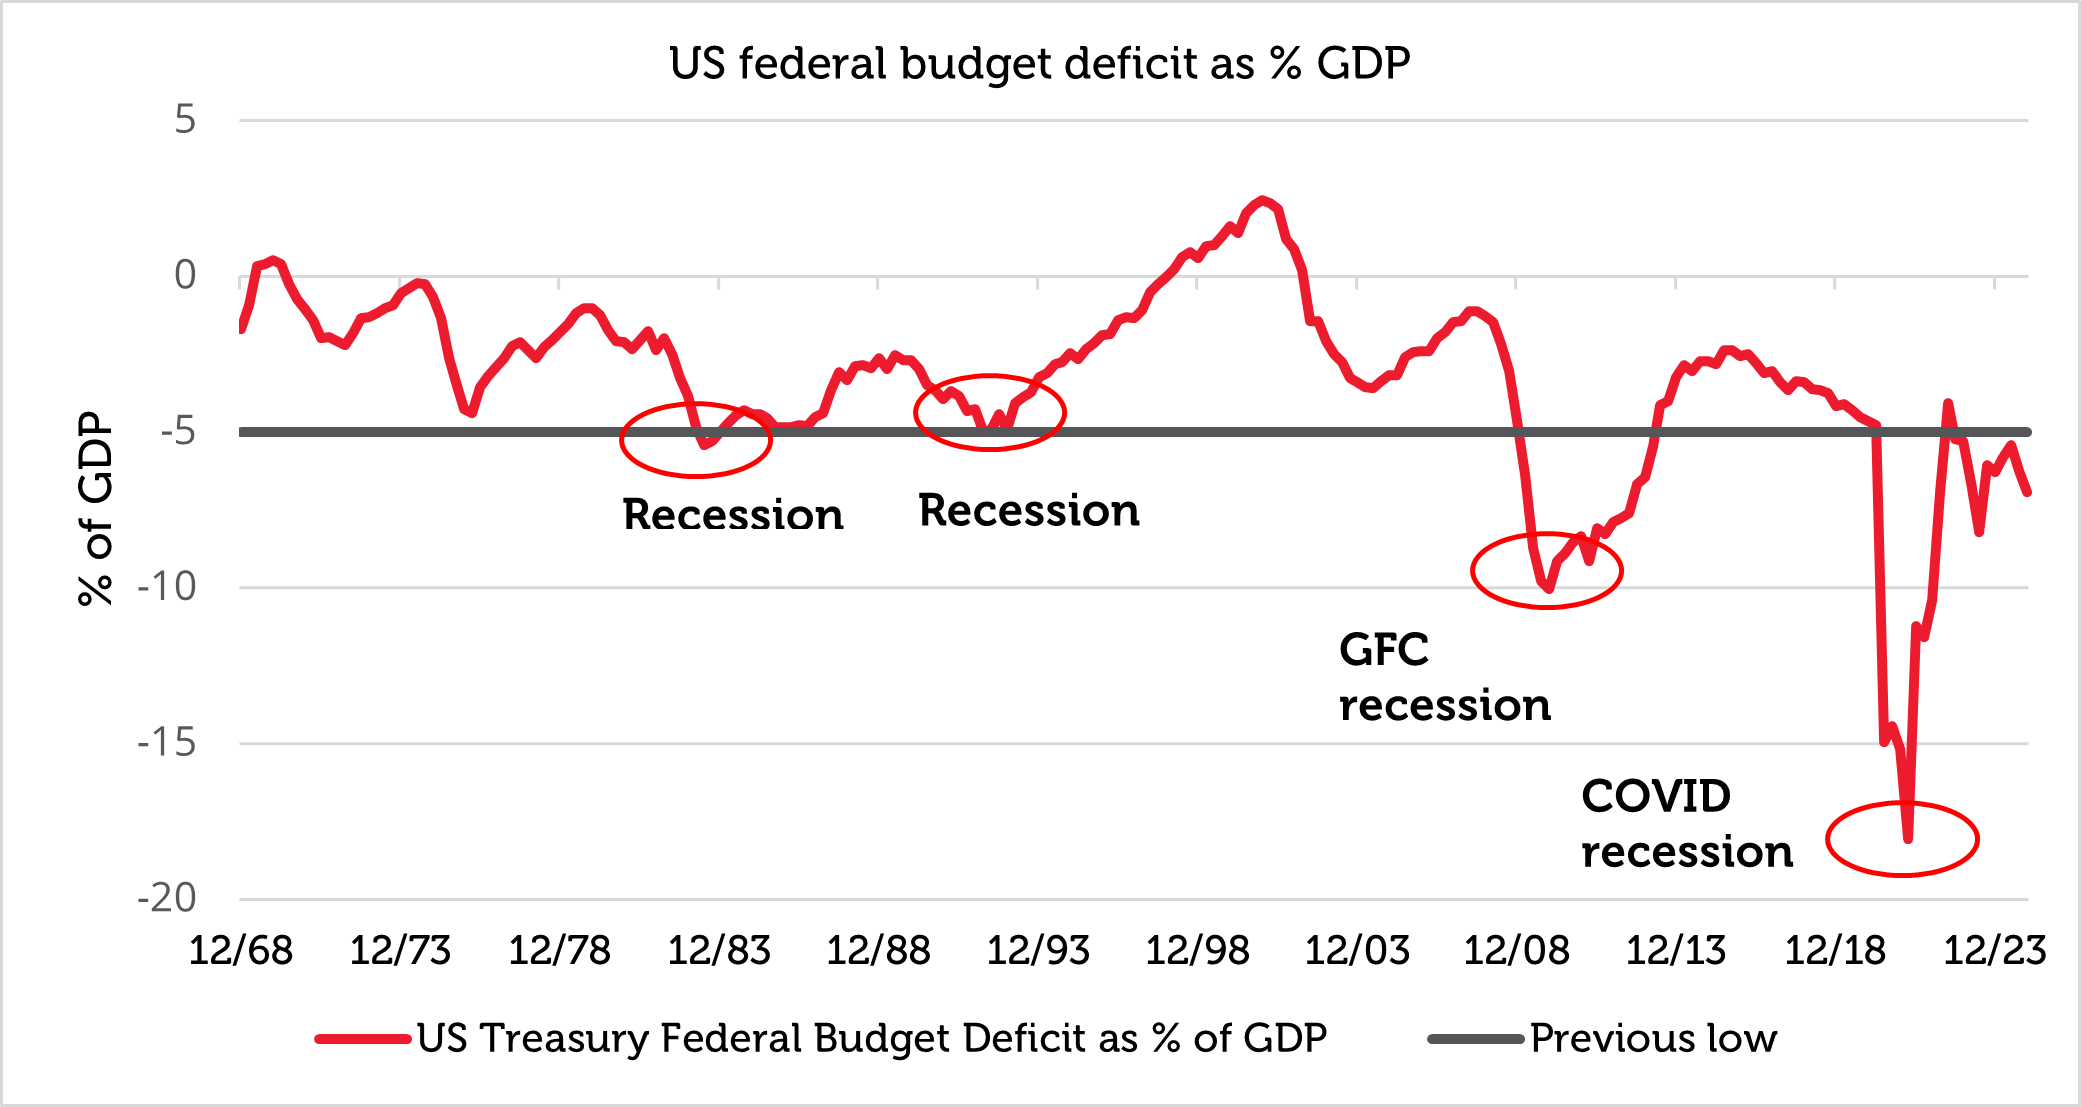
The US deficit is also running at 6% of GDP, a level typically seen during recessions, not economic expansions. With additional tax cuts on the table, fiscal stability is increasingly at risk. Markets appear to assume that deficit spending will have no consequences, but historical precedent suggests otherwise.
4. Inflation risks and bond vigilantism
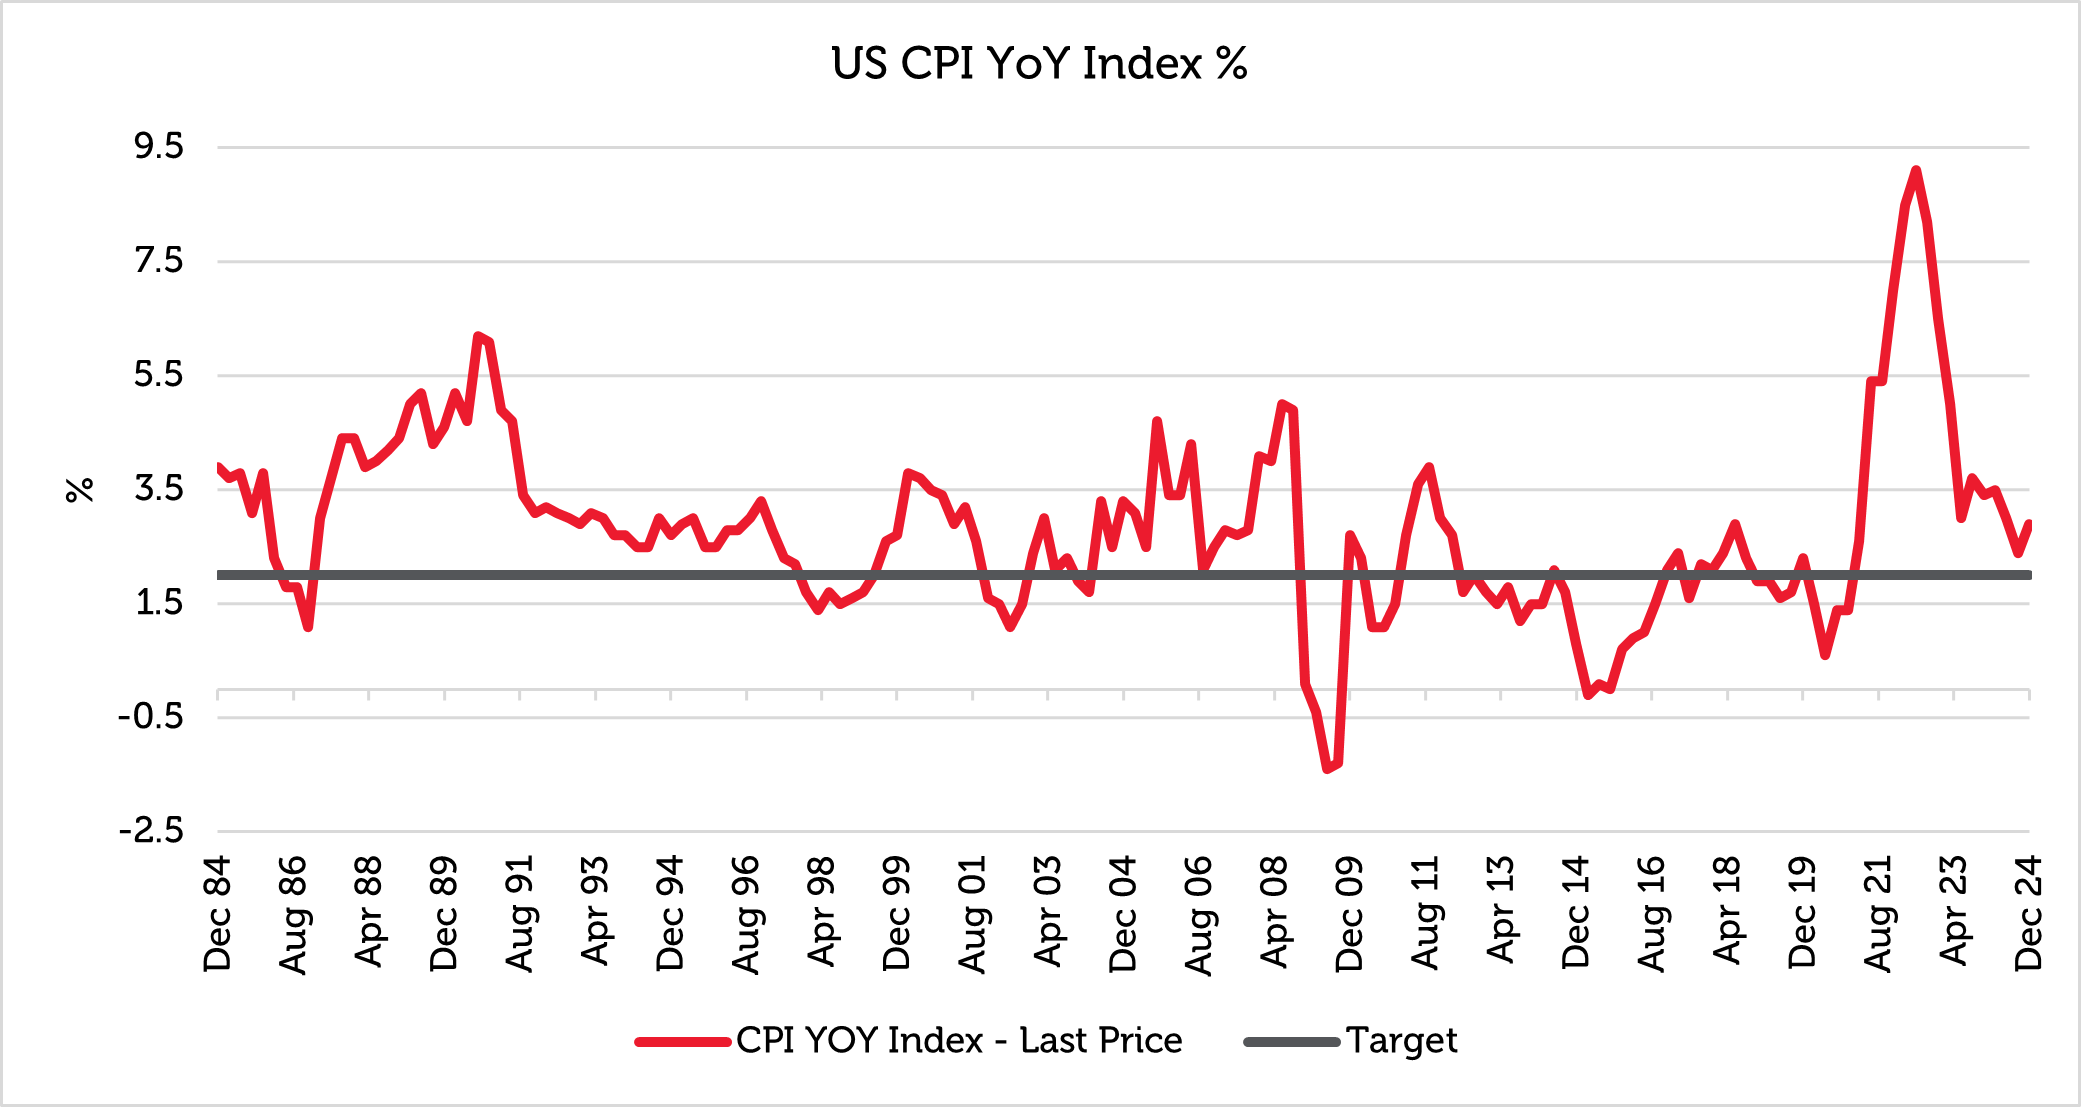
Consensus remains convinced that inflation will remain constrained, but again, history urges caution.
US CPI is currently at c.3%, and significant declines in inflation have historically only occurred in periods of deep economic contraction (e.g., post-GFC). Given tight labour conditions and rising fiscal pressures, it would be rare for inflation to decline from here.
Moreover, debt burdens of this scale have often been eroded by inflation, never by fiscal discipline. Trump’s austerity measures to reduce government spending are unlikely to impact debt levels and the administration could be incentivised to allow inflation to edge higher over time.
Finally, bond markets are signalling concern. The US 10-year yield is rising despite expectations for rate cuts. This last occurred in the 1970s when inflationary concerns ultimately materialised. Equity markets, however, appear to be ignoring these signals.
The case for a disciplined approach to total return investing
At the heart of today’s market optimism is a fragile assumption: US equity markets no longer mean revert. But history shows that excesses—whether in valuation, concentration, or fiscal conditions—eventually correct. Investors in broad equity benchmarks are taking on extraordinary risk, which is why we believe that now is precisely the time to increase allocations to active strategies that offers two key investment characteristics:
1. Rigorous buy / sell disciplines
Strict valuation-based investment disciplines can serve as guardrails to protect against the behavioural biases associated with excessive valuations.
The Redwheel Global Equity Income strategy achieves this by applying an objective yield discipline, ensuring that every stock always compounds at a higher yield than the market. The strategy only purchases stocks yielding at least 25% more than the world index and sells any that yield less than the market.
In addition, a focus on dividend sustainability naturally tilts portfolios toward cash-generative, durable businesses rather than speculative growth stories, ensuring that it avoids crowded trades where market and concentration risk are highest.
2. Maximising total returns
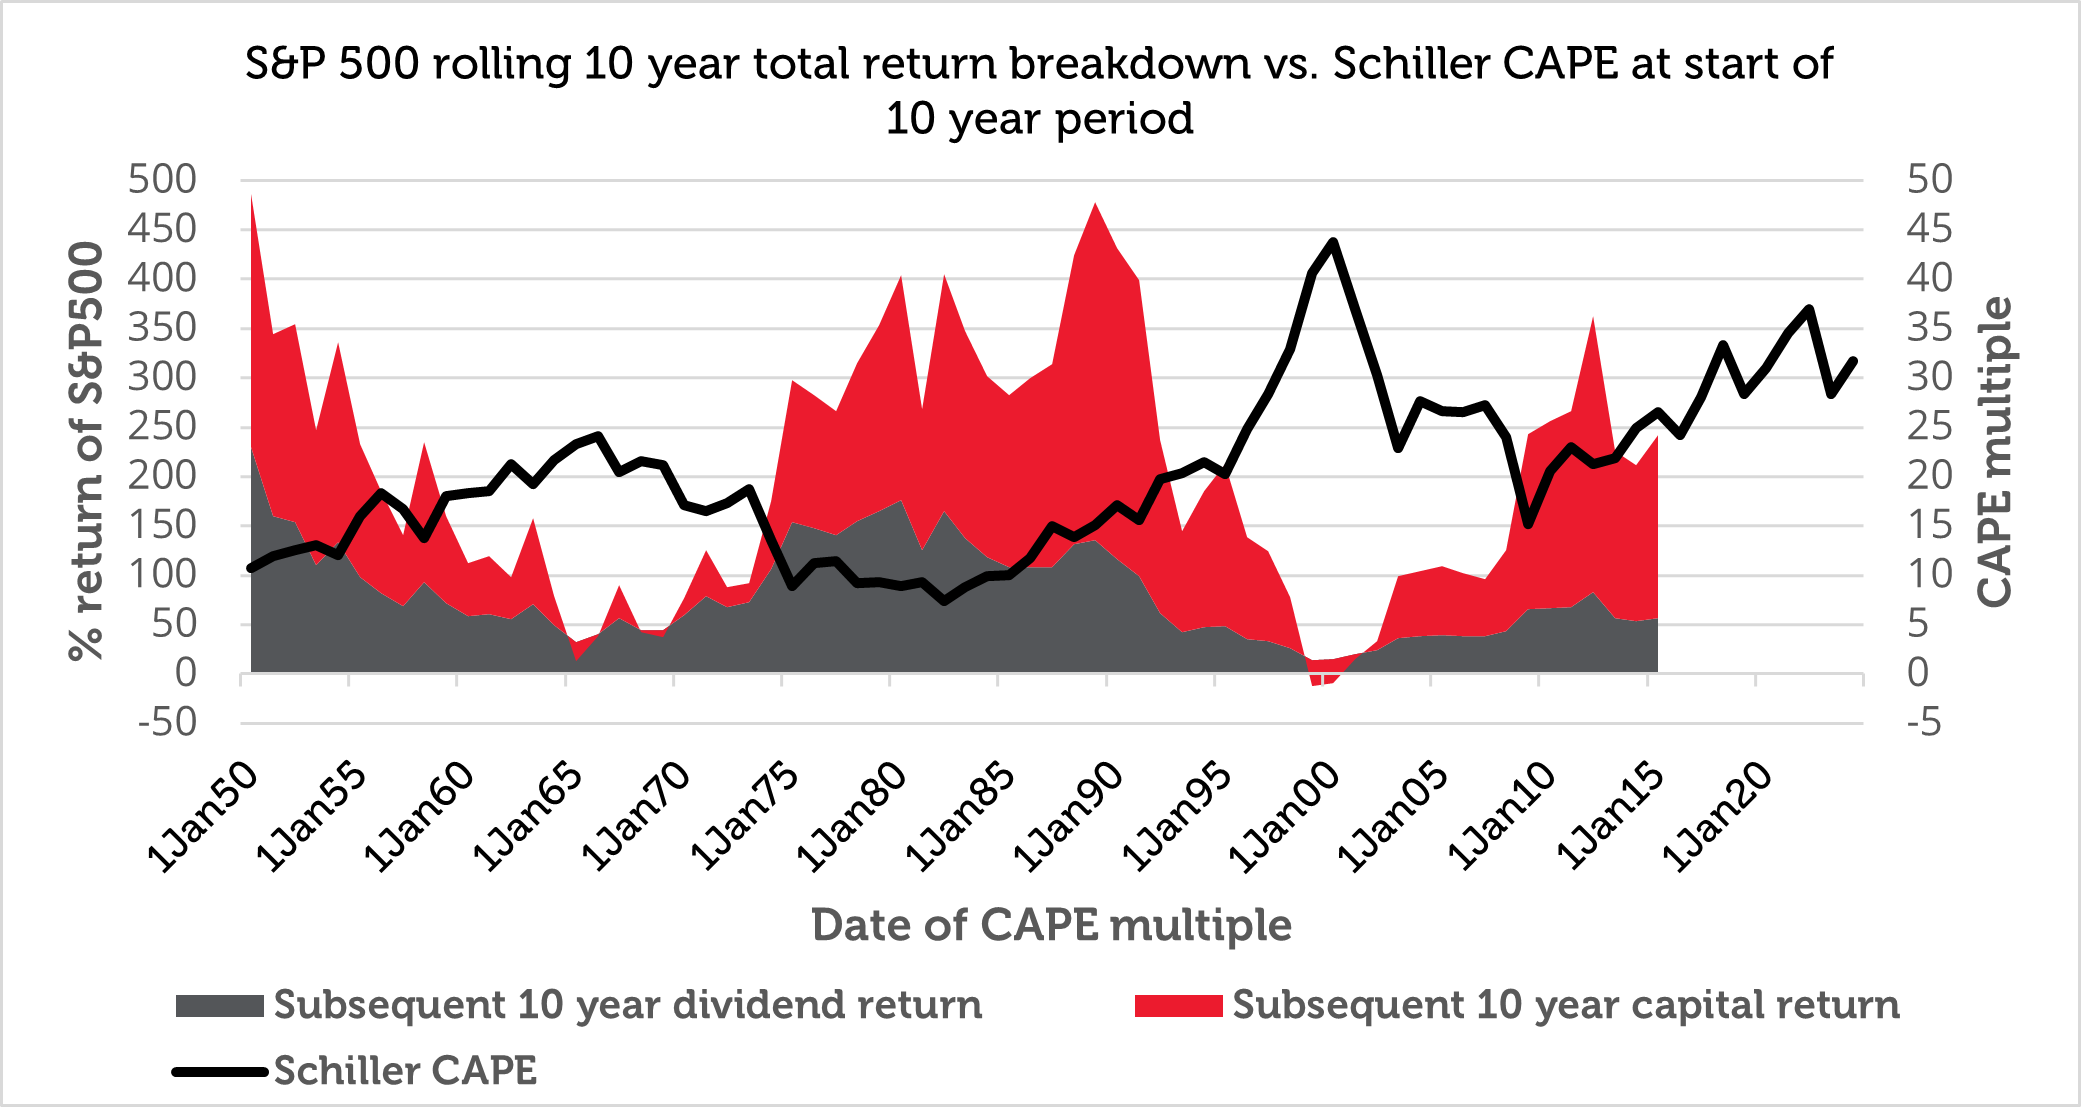
The chart below shows that dividends will likely dominate total returns of the S&P500 over the next ten years.
The composition of the total return over rolling 10-year periods changes meaningfully: sometimes capital return dominates, sometimes the dividend return. Moreover, it tends to correlate with the current valuation[4] at the start of each period. The higher the starting valuation, the greater the probability that the next 10 years’ total return will be driven by the dividend component.
Today’s excessive valuations therefore highlights the value of a quality dividend strategy that compounds a premium dividend yield to the market.
Exceptional conditions rarely persist
Today’s market assumes that growth, high valuations, and AI-driven momentum will continue indefinitely. By contrast, extreme concentration, fiscal risks, and stretched valuations all point to a heightened probability of mean reversion. In such an environment, anchoring portfolios to fundamental principles—quality, yield discipline, and diversification—is not just prudent; it is essential.
A disciplined dividend strategy ensures investors capture the compounding power of income while avoiding the risks of momentum-driven overvaluation. At a time when speculative excess is at its peak, we believe fundamentals provide the best defense against mean reversion when it inevitably arrives.
Sources:
[1] Bloomberg, 31 December 2024
[2] US Bureau of Labor Statistics
[3] US Bureau of Labor Statistics, January 2025
[4] Shiller CAPE: a widely used cyclically adjusted price/earnings ratio which measures how cheap or expensive the market is at any time by dividing the price of the market by the 10-year average inflation-adjusted earnings.
Key Information
No investment strategy or risk management technique can guarantee returns or eliminate risks in any market environment. Past performance is not a guide to future results. The prices of investments and income from them may fall as well as rise and an investor’s investment is subject to potential loss, in whole or in part. Forecasts and estimates are based upon subjective assumptions about circumstances and events that may not yet have taken place and may never do so. The statements and opinions expressed in this article are those of the author as of the date of publication, and do not necessarily represent the view of Redwheel. This article does not constitute investment advice and the information shown is for illustrative purposes only.
Michel Sznajer, Portfolio Manager, Ecofin Global Renewables Infrastructure strategy, reflects on ten years of outperformance with a lower beta and the opportunities he sees ahead as electrification accelerates. He makes a compelling case that now is the time to gain explicit exposure to electricity amid a powerful structural tailwind from rising demand.
Is ‘Quality at any price’ still a viable investment strategy amid widespread corporate disruption? For Nick Clay, Portfolio Manager, Redwheel Global Equity Income, shortening corporate lifespans, relative underperformance of Quality stocks and sudden re-ratings of AI ‘winners’ all suggest otherwise. A disciplined focus on yield, valuation and controversy is now critical to investing in durable Quality in the age of AI.
With major elections in Brazil, Colombia and Peru on the horizon, the Redwheel Emerging, Frontier and International Markets team assesses the potential impact of a broad shift toward economic orthodoxy on regional equity markets. They argue that shifting policies, combined with falling interest rates, a weaker US dollar and recovering commodity prices, could pave the way for a durable market re rating.
Redwheel ® and Ecofin ® are registered trademarks of RWC Partners Limited (“RWC”). The term “Redwheel” may include any one or more Redwheel branded regulated entities including RWC Asset Management LLP, which is authorised and regulated by the UK Financial Conduct Authority and the US Securities and Exchange Commission (“SEC”); RWC Asset Advisors (US) LLC, which is registered with the SEC; RWC Singapore (Pte) Limited, which is licensed as a Licensed Fund Management Company by the Monetary Authority of Singapore; Redwheel Australia Pty Ltd is an Australian Financial Services Licensee with the Australian Securities and Investment Commission; and Redwheel Europe Fondsmæglerselskab A/S which is regulated by the Danish Financial Supervisory Authority.
Redwheel may act as investment manager or adviser, or otherwise provide services, to more than one product pursuing a similar investment strategy or focus to the product detailed in this document. Redwheel and RWC (together “Redwheel Group”) seeks to minimise any conflicts of interest, and endeavours to act at all times in accordance with its legal and regulatory obligations as well as its own policies and codes of conduct.
This document is directed only at professional, institutional, wholesale or qualified investors. The services provided by Redwheel are available only to such persons. It is not intended for distribution to and should not be relied on by any person who would qualify as a retail or individual investor in any jurisdiction or for distribution to, or use by, any person or entity in any jurisdiction where such distribution or use would be contrary to local law or regulation.
This document has been prepared for general information purposes only and has not been delivered for registration in any jurisdiction nor has its content been reviewed or approved by any regulatory authority in any jurisdiction.
The information contained herein does not constitute: (i) a binding legal agreement; (ii) legal, regulatory, tax, accounting or other advice; (iii) an offer, recommendation or solicitation to buy or sell shares in any fund, security, commodity, financial instrument or derivative linked to, or otherwise included in a portfolio managed or advised by Redwheel; or (iv) an offer to enter into any other transaction whatsoever (each a “Transaction”). Redwheel Group bears no responsibility for your investment research and/or investment decisions and you should consult your own lawyer, accountant, tax adviser or other professional adviser before entering into any Transaction. No representations and/or warranties are made that the information contained herein is either up to date and/or accurate and is not intended to be used or relied upon by any counterparty, investor or any other third party.
Redwheel Group uses information from third party vendors, such as statistical and other data, that it believes to be reliable. However, the accuracy of this data, which may be used to calculate results or otherwise compile data that finds its way over time into Redwheel Group research data stored on its systems, is not guaranteed. If such information is not accurate, some of the conclusions reached or statements made may be adversely affected. Any opinion expressed herein, which may be subjective in nature, may not be shared by all directors, officers, employees, or representatives of Group and may be subject to change without notice. Redwheel Group is not liable for any decisions made or actions or inactions taken by you or others based on the contents of this document and neither Redwheel Group nor any of its directors, officers, employees, or representatives (including affiliates) accepts any liability whatsoever for any errors and/or omissions or for any direct, indirect, special, incidental, or consequential loss, damages, or expenses of any kind howsoever arising from the use of, or reliance on, any information contained herein.
Information contained in this document should not be viewed as indicative of future results. Past performance of any Transaction is not indicative of future results. The value of investments can go down as well as up. Certain assumptions and forward looking statements may have been made either for modelling purposes, to simplify the presentation and/or calculation of any projections or estimates contained herein and Redwheel Group does not represent that that any such assumptions or statements will reflect actual future events or that all assumptions have been considered or stated. There can be no assurance that estimated returns or projections will be realised or that actual returns or performance results will not materially differ from those estimated herein. Some of the information contained in this document may be aggregated data of Transactions executed by Redwheel that has been compiled so as not to identify the underlying Transactions of any particular customer.
No representations or warranties of any kind are intended or should be inferred with respect to the economic return from, or the tax consequences of, an investment in a Redwheel-managed fund.
This document expresses no views as to the suitability or appropriateness of the fund or any other investments described herein to the individual circumstances of any recipient.
The information transmitted is intended only for the person or entity to which it has been given and may contain confidential and/or privileged material. In accepting receipt of the information transmitted you agree that you and/or your affiliates, partners, directors, officers and employees, as applicable, will keep all information strictly confidential. Any review, retransmission, dissemination or other use of, or taking of any action in reliance upon, this information is prohibited. Any distribution or reproduction of this document is not authorised and is prohibited without the express written consent of Redwheel Group.
Funds managed by Redwheel are not, and will not be, registered under the Securities Act of 1933 (the “Securities Act”) and are not available for purchase by US persons (as defined in Regulation S under the Securities Act) except to persons who are “qualified purchasers” (as defined in the Investment Company Act of 1940) and “accredited investors” (as defined in Rule 501(a) under the Securities Act).
This document does not constitute an offer to sell, purchase, subscribe for or otherwise invest in units or shares of any fund managed by Redwheel. Any offering is made only pursuant to the relevant offering document and the relevant subscription application. Prospective investors should review the offering memorandum in its entirety, including the risk factors in the offering memorandum, before making a decision to invest.
AIFMD and Distribution in the European Economic Area (“EEA”)
The Alternative Fund Managers Directive (Directive 2011/61/EU) (“AIFMD”) is a regulatory regime which came into full effect in the EEA on 22 July 2014. RWC Asset Management LLP is an Alternative Investment Fund Manager (an “AIFM”) to certain funds managed by it (each an “AIF”). The AIFM is required to make available to investors certain prescribed information prior to their investment in an AIF. The majority of the prescribed information is contained in the latest Offering Document of the AIF. The remainder of the prescribed information is contained in the relevant AIF’s annual report and accounts. All of the information is provided in accordance with the AIFMD.
In relation to each member state of the EEA (each a “Member State”), this document may only be distributed and shares in a Redwheel fund (“Shares”) may only be offered and placed to the extent that (a) the relevant Redwheel fund is permitted to be marketed to professional investors in accordance with the AIFMD (as implemented into the local law/regulation of the relevant Member State); or (b) this document may otherwise be lawfully distributed and the Shares may lawfully be offered or placed in that Member State (including at the initiative of the investor).
Information Required for Offering in Switzerland of Foreign Collective Investment Schemes to Qualified Investors within the meaning of Article 10 CISA.
This is an advertising document.
The representative and paying agent of the Redwheel-managed funds in Switzerland (the “Representative in Switzerland”) FIRST INDEPENDENT FUND SERVICES LTD, Feldeggstrasse 12, CH-8008 Zurich. Swiss Paying Agent: Helvetische Bank AG, Seefeldstrasse 215, CH-8008 Zurich. In respect of the units of the Redwheel-managed funds offered in Switzerland, the place of performance is at the registered office of the Swiss Representative. The place of jurisdiction is at the registered office of the Swiss Representative or at the registered office or place of residence of the investor.
Redwheel ® and Ecofin ® are registered trademarks of RWC Partners Limited. The term “Redwheel” may include any one or more Redwheel regulated entities including RWC Asset Management LLP, which is authorised and regulated by the Financial Conduct Authority in the United Kingdom (“RWC”). RWC is incorporated in England and Wales with its registered office at Verde 4th Floor, 10 Bressenden Place, London, SW1E 5DH, United Kingdom and its registered number is OC332015.
No investment strategy or risk management technique can guarantee returns or eliminate risks in any market environment.The term “RWC” may include any one or more RWC branded entities including RWC Partners Limited and RWC Asset Management LLP, each of which is authorised and regulated by the UK Financial Conduct Authority and, in the case of RWC Asset Management LLP, the US Securities and Exchange Commission; RWC Asset Advisors (US) LLC, which is registered with the US Securities and Exchange Commission; and RWC Singapore (Pte) Limited, which is licensed as a Licensed Fund Management Company by the Monetary Authority of Singapore.RWC may act as investment manager or adviser, or otherwise provide services, to more than one product pursuing a similar investment strategy or focus to the product detailed in this audio. RWC seeks to minimise any conflicts of interest, and endeavours to act at all times in accordance with its legal and regulatory obligations as well as its own policies and codes of conduct.This audio is directed only at professional, institutional, wholesale or qualified investors. The services provided by RWC are available only to such persons. It is not intended for distribution to and should not be relied on by any person who would qualify as a retail or individual investor in any jurisdiction or for distribution to, or use by, any person or entity in any jurisdiction where such distribution or use would be contrary to local law or regulation.This audio has been prepared for general information purposes only and has not been delivered for registration in any jurisdiction nor has its content been reviewed or approved by any regulatory authority in any jurisdiction. The information contained herein does not constitute: (i) a binding legal agreement; (ii) legal, regulatory, tax, accounting or other advice; (iii) an offer, recommendation or solicitation to buy or sell shares in any fund, security, commodity, financial instrument or derivative linked to, or otherwise included in a portfolio managed or advised by RWC; or(iv) an offer to enter into any other transaction whatsoever (each a “Transaction”). No representations and/or warranties are made that the information contained herein is either up to date and/or accurate and is not intended to be used or relied upon by any counterparty, investor or any other third party.RWC uses information from third party vendors, such as statistical and other data, that it believes to be reliable. However, the accuracy of this data, which may be used to calculate results or otherwise compile data that finds its way over time into RWC research data stored on its systems, is not guaranteed. If such information is not accurate, some of the conclusions reached or statements made may be adversely affected. RWC bears no responsibility for your investment research and/or investment decisions and you should consult your own lawyer, accountant, tax adviser or other professional adviser before entering into any Transaction. Any opinion expressed herein, which may be subjective in nature, may not be shared by all directors, officers, employees, or representatives of RWC and may be subject to change without notice. RWC is not liable for any decisions made or actions or in actions taken by you or others based on the contents of this audio and neither RWC nor any of its directors, officers, employees, or representatives (including affiliates) accepts any liability whatsoever for any errors and/or omissions or for any direct, indirect, special, incidental, or consequential loss, damages, or expenses of any kind howsoever arising from the use of, or reliance on, any information contained herein.Information contained in this audio should not be viewed as indicative of future results. Past performance of any Transaction is not indicative of future results. The value of investments can go down as well as up. Certain assumptions and forward looking statements may have been made either for modelling purposes, to simplify the audio and/or calculation of any projections or estimates contained herein and RWC does not represent that that any such assumptions or statements will reflect actual future events or that all assumptions have been considered or stated. Forward-looking statements are inherently uncertain, and changing factors such as those affecting the markets generally, or those affecting particular industries or issuers, may cause results to differ from those discussed. Accordingly, there can be no assurance that estimated returns or projections will be realised or that actual returns or performance results will not materially differ from those estimated herein. Some of the information contained in this audio may be aggregated data of Transactions executed by RWC that has been compiled so as not to identify the underlying Transactions of any particular customer.The information transmitted is intended only for the person or entity to which it has been given and may contain confidential and/or privileged material. In accepting receipt of the information transmitted you agree that you and/or your affiliates, partners, directors, officers and employees, as applicable, will keep all information strictly confidential. Any review, retransmission, dissemination or other use of, or taking of any action in reliance upon, this information is prohibited. The information contained herein is confidential and is intended for the exclusive use of the intended recipient(s) to which this audio has been provided. Any distribution or reproduction of this audio is not authorised and is prohibited without the express written consent of RWC or any of its affiliates.Changes in rates of exchange may cause the value of such investments to fluctuate. An investor may not be able to get back the amount invested and the loss on realisation may be very high and could result in a substantial or complete loss of the investment. In addition, an investor who realises their investment in a RWC-managed fund after a short period may not realise the amount originally invested as a result of charges made on the issue and/or redemption of such investment. The value of such interests for the purposes of purchases may differ from their value for the purpose of redemptions. No representations or warranties of any kind are intended or should be inferred with respect to the economic return from, or the tax consequences of, an investment in a RWC-managed fund. Current tax levels and reliefs may change. Depending on individual circumstances, this may affect investment returns. Nothing in this document constitutes advice on the merits of buying or selling a particular investment. This audio expresses no views as to the suitability or appropriateness of the fund or any other investments described herein to the individual circumstances of any recipient.AIFMD and Distribution in the European Economic Area (“EEA”)The Alternative Fund Managers Directive (Directive 2011/61/EU)(“AIFMD”) is a regulatory regime which came into full effect in the EEA on 22 July 2014. RWC Asset Management LLP is an Alternative Investment Fund Manager (an “AIFM”) to certain funds managed by it (each an “AIF”). The AIFM is required to make available to investors certain prescribed information prior to their investment in an AIF. The majority of the prescribed information is contained in the latest Offering Document of the AIF. The remainder of the prescribed information is contained in the relevant AIF’s annual report and accounts. All of the information is provided in accordance with the AIFMD.In relation to each member state of the EEA (each a “Member State”),this document may only be distributed and shares in a RWC fund(“Shares”) may only be offered and placed to the extent that (a) the relevant RWC fund is permitted to be marketed to professional investors in accordance with the AIFMD (as implemented into the local law/regulation of the relevant Member State); or (b) this audio may otherwise be lawfully distributed and the Shares may lawfully offered or placed in that Member State (including at the initiative of the investor).Information Required for Distribution of Foreign Collective Investment Schemes to Qualified Investors in SwitzerlandThe representative and paying agent of the RWC-managed funds in Switzerland (the “Representative in Switzerland”) FIRST INDEPENDENT FUND SERVICES LTD, Klausstrasse 33, CH-8008 Zurich. Swiss Paying Agent: Helvetische Bank AG, Seefeldstrasse 215, CH-8008 Zurich. In respect of the units of the RWC-managed funds distributed in Switzerland, the place of performance and jurisdiction is at the registered office of the Representative in Switzerland.